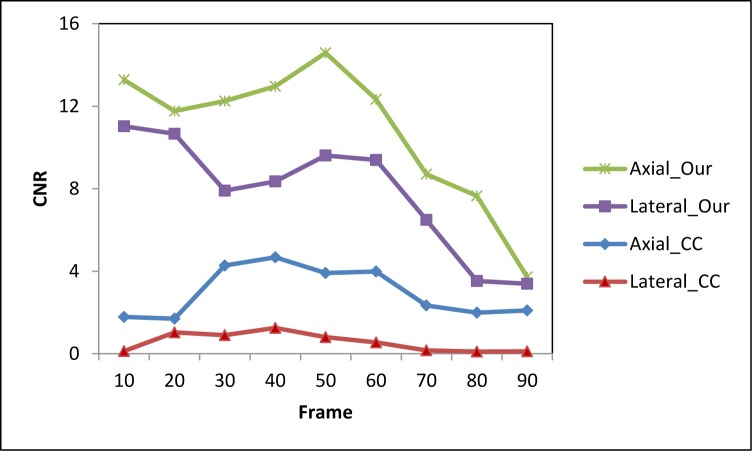
Fig 7. A comparison of the CNR between the two methods under different strains.
This is the axial and lateral CNR from the two methods. The ROI 1 in Fig 3 was seen as a target and ROI 2 was viewed as the background. ROI 1 and 2 were used to calculate the CNR in the axial strain images of both methods, while ROI 1 and 3 were used to calculate CNR in lateral strain images of both methods.

