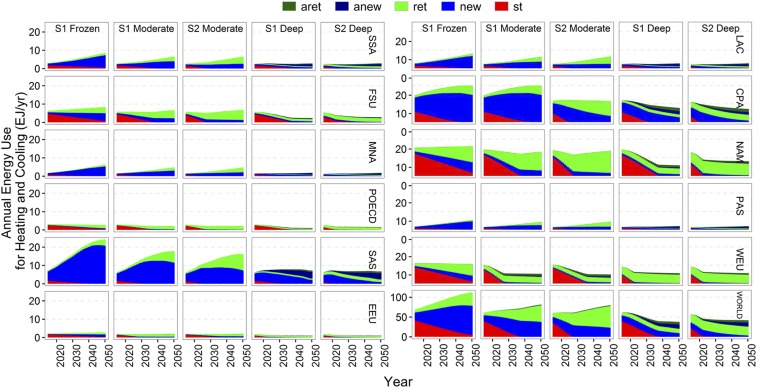
Fig. 3.
Regional and global heating and cooling energy use scenarios from the bottom-up analysis. The difference between S1 and S2 variants is that the latter assumes faster adoption of the respective retrofit technology under each scenario. Colors show the energy use divided into different vintages: st (existing stock with standard technology in 2010), new (new buildings with standard technology as of 2010), ret (existing stock with standard retrofit technology as of 2010), aret (existing stock with advanced retrofit technology), and anew (new buildings with advanced technology). The regional breakdown is provided in Fig. 1. Results are also provided in tabular format in Dataset S3.

