Fig. 1.
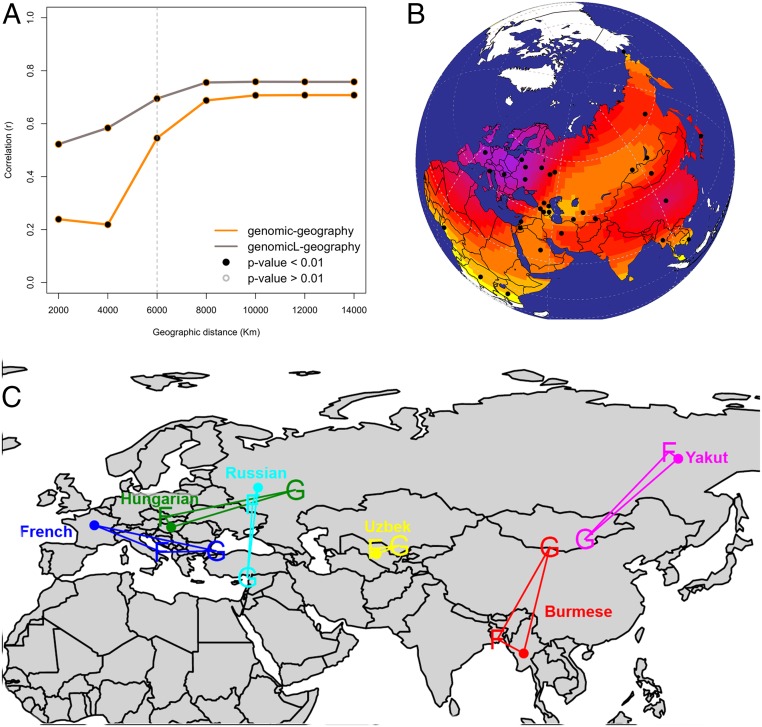
(A) Plot of product–moment correlation values between pairwise genetic distance (both whole genome and biased for linguistic barriers) and pairwise geographic distance over cumulative geographic distance. (B) Map showing the spatial distribution of 33 populations in dataset MAIN. Surface colors represent interpolated richness values (i.e., the number of folktales exhibited by each population). Purple indicates higher values, whereas yellow indicates lower numbers. (C) Example of a map with SpaceMix results for genetic and folktale distance both projected on standard geographic coordinates. It is evident how, overall, folktale distribution (F) tends to cluster closer to geographic coordinates (dots), whereas the inferred source and direction of possible genetic admixture (G) are mismatched. For example, Burmese and Yakut exhibit quite segregated folktale assemblages, whereas their putative source of genetic admixture is closer in space. The case of Hungarian is emblematic for its folkloric assemblage rooted in Europe, whereas its putative genetic (and linguistic) source of admixture is located in the Ural region.

