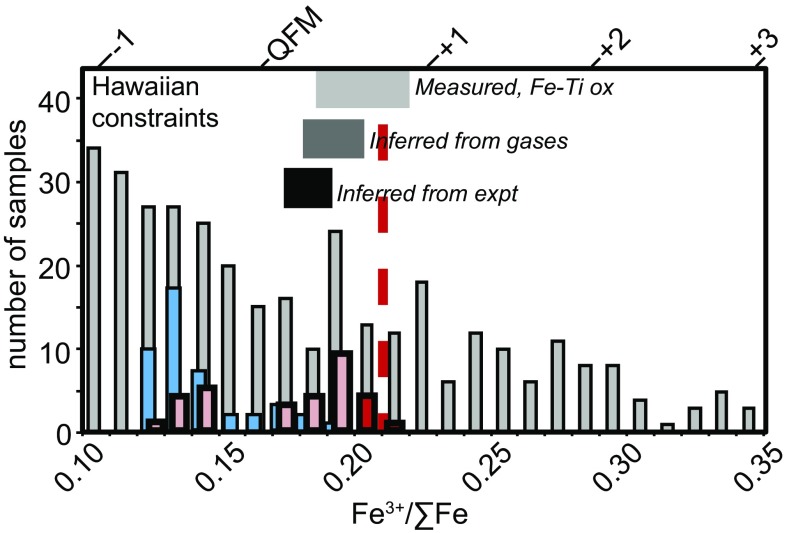
Fig. 2.
Histogram comparing Fe3+/ΣFe ratios in 29 HSDP2 glasses (this study, red and pink bars) and 44 glasses from Kilauea volcano (17) (blue bars), all measured using XANES, compared with those in whole rocks measured by wet chemistry (gray bars). Also shown are ranges in fO2 values at the temperatures relevant for each dataset, relative to QFM (shown as shaded horizontal bars) for Hawaiian volcanism based on analyses of volcanic gases (33, 38) analyses of coexisting Fe−Ti oxides (30), or gas mixing experiments (31). The heavy red vertical dashed line is the average of three undegassed HSDP2 samples. The fO2 scale on the upper horizontal axis was calculated as in Fig. 1, for a representative MORB composition (42), and should be taken as approximate fO2 for OIB samples.

