Fig. 3.
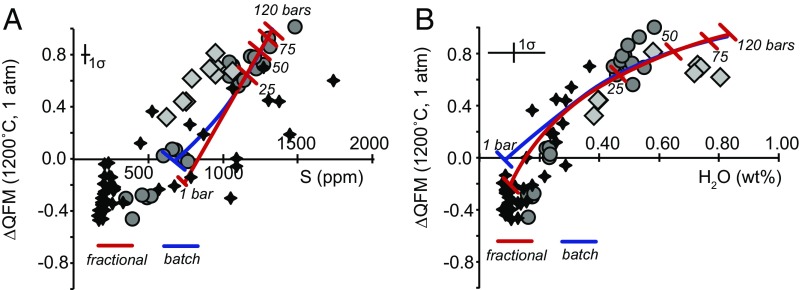
(A) The fO2 values (relative to QFM) for each of the HSDP glasses (calculated as in Fig. 1) vs. S concentration of the glass (24). Also shown are the results of fractional (red curve) and batch (blue curve) degassing calculations based on the D-Compress software from ref. 35. Tick marks represent increments of decompression from 120 bars to 1 bar total pressure. Symbols are as in Fig. 1. (B) Same as A, except fO2 is shown vs. H2O content of the glass.

