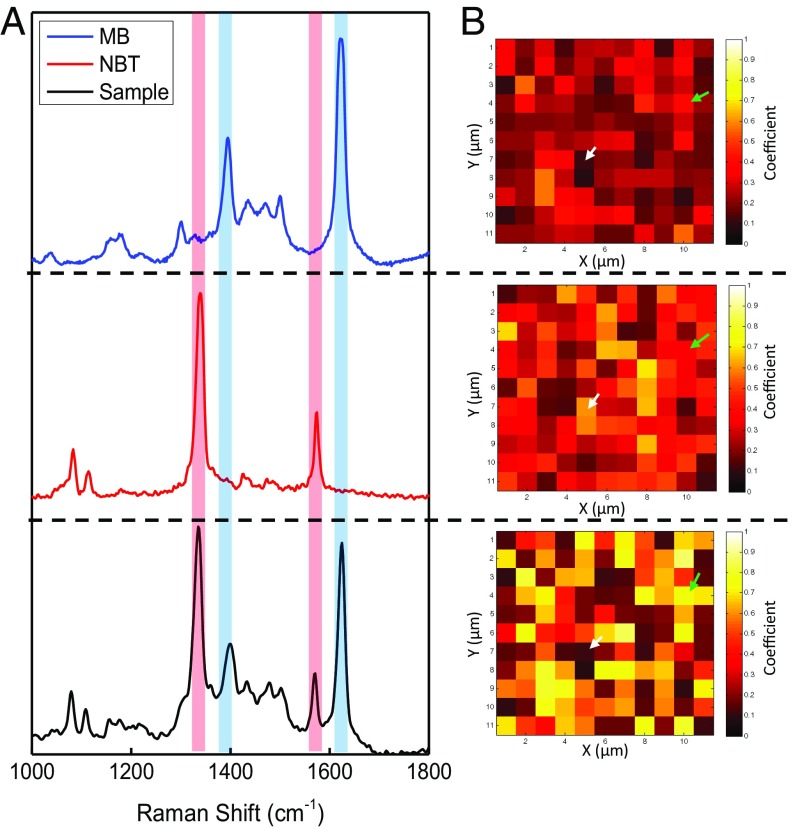
Fig. 3.
Graphical summary of the results of the CLS analysis used to determine the relative contributions of the two Raman tags for a representative assay with 0.5 M thrombin. (A) SERS spectra in the range from 1,000 cm−1 to 1,800 cm−1, showing reference SERS spectra of (Top) MB, (Middle) NBT, and (Bottom) a single representative spectrum from the raster scans after an assay has been conducted. The red and blue shaded bars highlight prominent peaks associated with NBT and MB, respectively. (B) Heat maps based on the coefficients returned by CLS analysis for (Top) MB, (Middle) NBT, and (Bottom) the sum of the NBT and MB coefficients for sites with above-threshold values. Brighter color indicates a greater contribution by that tag. Green arrows indicate an example of a true-positive sector, where both reporter coefficients are above threshold. White arrows show an example of a false-positive sector, where one of the two reporters is below threshold.

