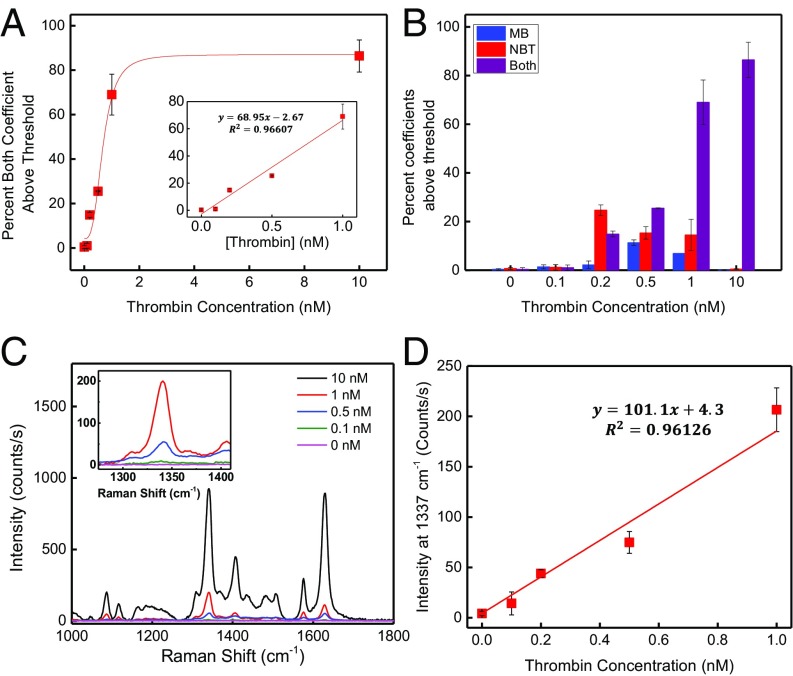
Fig. 4.
Summary of results from single- and dual-reporter SERS assays. (A) Standard thrombin-binding curve in 5 µM albumin for the dual-reporter assay. Inset shows the low-concentration portion of the graph, expanded for clarity. (B) Summary of results from CLS analysis expressed as percentage of contribution from each tag in the dual-reporter assay. Blue bars (MB only) indicate signal derived from film defects, whereas red bars (NBT only) indicate spectra derived from AuNP aggregates. Purple bars indicate true protein-binding events. (C) Average intensity of all 121 spectra as a function of thrombin concentration for the single-reporter SERS assay. Inset shows the 1,337-cm−1 region expanded for clarity. (D) Intensity of the 1,337-cm−1 peak as a function of thrombin concentration for the single-reporter assay.

