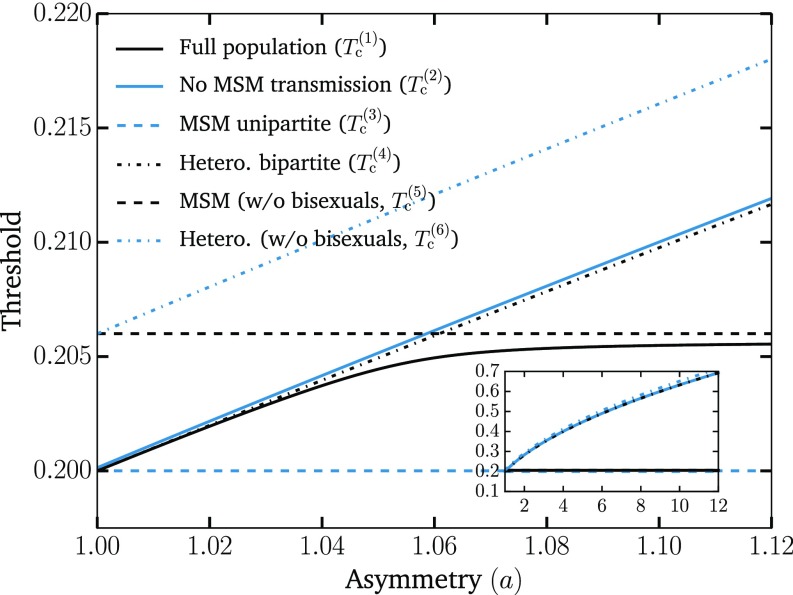
Fig. 2.
Separation of thresholds with increasing asymmetry. We show the two thresholds (critical points) and discussed in the text (solid lines) as well as the thresholds for different subpopulations (dotted lines), which can be easily calculated and further support our interpretation of the phenomenology. The first threshold, , corresponds to the epidemic threshold for the full population. The second threshold, , is computed by setting the transmission between MSM to zero. The MSM unipartite and Hetero. bipartite lines show the epidemic thresholds should the network be only populated with MSM or heterosexuals, respectively. They are defined as and , respectively, where is the average excess degree of the nodes (12). The last two thresholds correspond to the contributions to and that involve exclusively the homosexual male or heterosexual subpopulations, respectively. They are the solutions of and , respectively, where nodes of type zero, four, and five correspond to homosexual males, heterosexual males, and heterosexual females, respectively. These results, therefore, support the interpretation that the first threshold corresponds to the invasion of the MSM subpopulation [with and acting as lower and upper bounds, respectively] and that the second threshold is caused by the invasion of the remaining population [with and acting as lower and upper bounds, respectively]. Inset shows the growing separation of the two main thresholds as asymmetry increases to values close to what we expect for ZIKV. The same parameters as in Fig. 1 were used.

