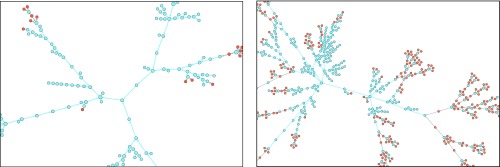
Fig. 3.
Composition of the components as the transmissibility increases. Nodes corresponding to males and females are shown in blue and orange, respectively, and arrows indicate who infected whom. The same parameters as for Fig. 1 have been used with asymmetry . (Left) At , the infection mostly follows the MSM subpopulation, with minimal and subcritical spillovers in the remaining population. (Right) At , the spillover causes cascades of power law-distributed sizes into the heterosexual population.

