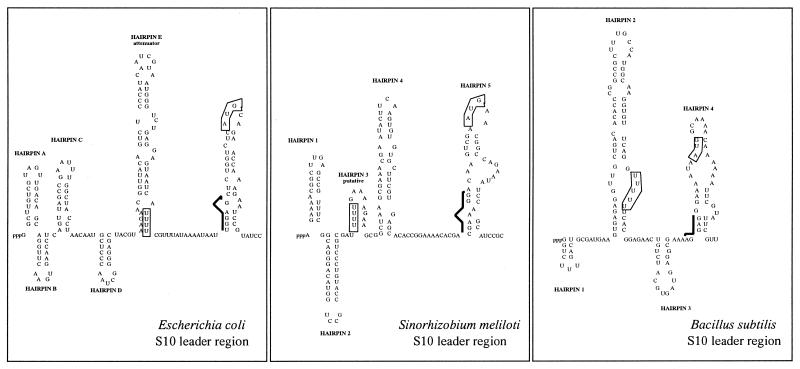
Figure 3.
Comparison of S10 leader structures of E.coli, B.subtilis and S.meliloti. The structures of the E.coli and B.subtilis S10 leader regions have been previously described (23–25). That of the S meliloti leader was obtained using MFOLD v.2.3 (http://mfold2.wustl.edu/∼mfold/rna/form1.cgi). Putative Shine–Dalgarno sequences are indicated by a black line.

