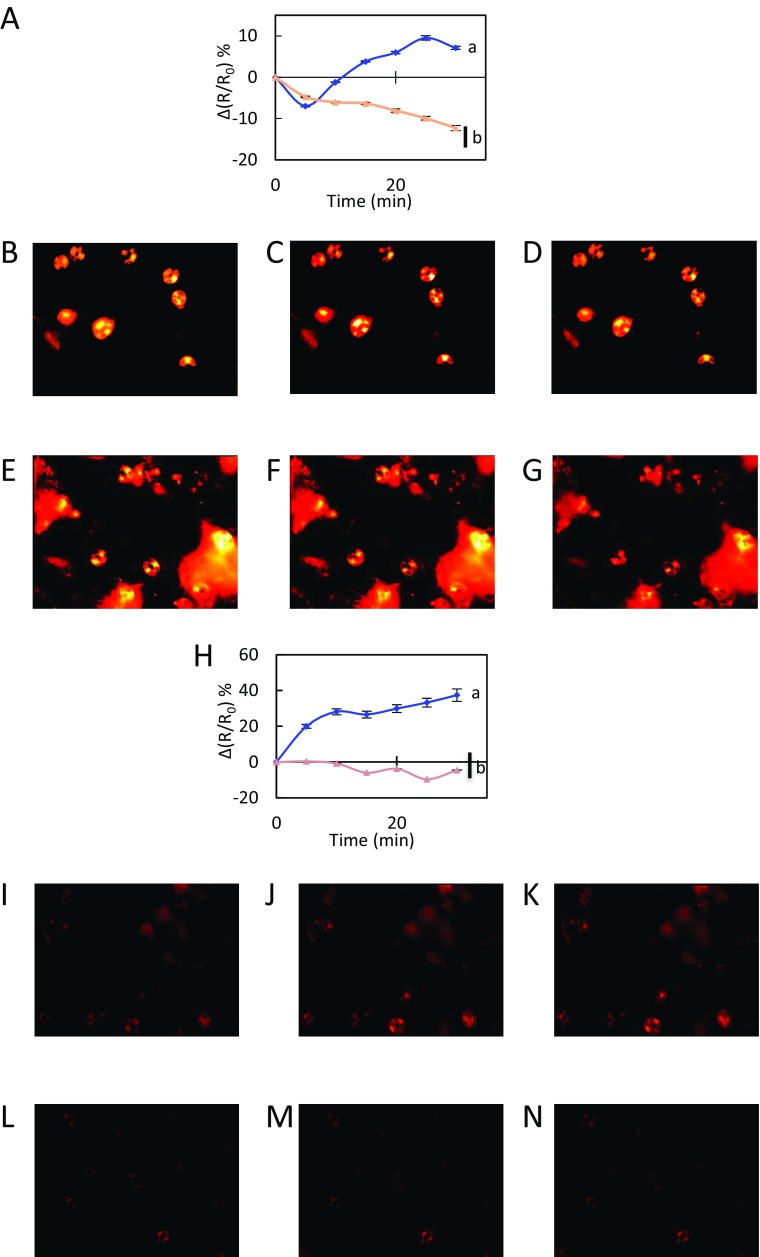
Fig. S4.
Kinetic variations of HyPer fluorescence induced by flg22 in guard cells. Col-0 (blue diamonds) and pip2;1-2 (tan triangles) epidermal peels were exposed to light during 3 h before treatment (t = 0) with 50 µM ABA (A–G) or 1 µM flg22 (H–N) as described in Fig. 1. Representative images of changes of HyPer fluorescence ratio (R) are shown at t = 0 (B, E, I, and L), t = 20 min (C, F, J, and M), and t = 30 min (D, G, K, and N). As cumulative data shown in Fig. 1 and in A and H is the average of three independent experiments with more than 30 guard cells analyzed, the images shown here do not reflect perfectly the average ratio changes measured in this study. Movies of the whole kinetics are also available (Movies S1–S4).

