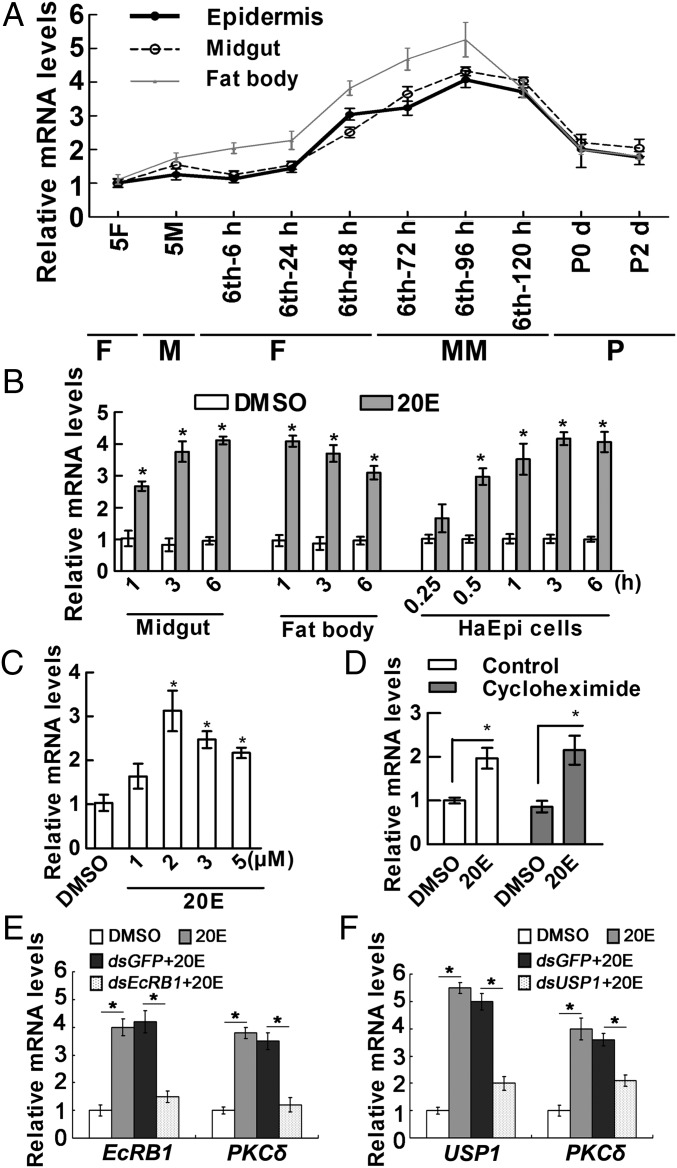
Fig. 1.
qRT-PCR showing the 20E-regulated expression of PKCδ. (A) Expression profiles of PKCδ in tissues during larval development. Sixth-6, sixth-24, sixth-48, sixth-72, sixth-96, and sixth-120 represent sixth instar larvae at the corresponding hours. P0 d and P2 d indicate 0- and 2-d-old pupae. 5F, fifth instar feeding larvae; 5M, fifth instar molting larvae; F, feeding; M, molting; MM, metamorphic molting; P, pupae. (B) The transcript levels of PKCδ in the midgut, fat body (injection of 500 ng of 20E/larva), and HaEpi cells (2 μM 20E). Equal diluted DMSO was used as a solvent control. (C) Expression of PKCδ in HaEpi cells after being treated with different concentrations of 20E for 3 h. Equal diluted DMSO was used as a control. (D) Expression of PKCδ when protein synthesis was inhibited by cycloheximide. The control experimental cells were treated with DMSO or 2 μM 20E for 3 h. Other cells were incubated with 50 μM cycloheximide for 30 min and then treated with 2 μM 20E for 3 h. (E and F) Knockdown of EcRB1 or USP1 using dsEcRB1 or dsUSP1 (2 μg/mL for 48 h) in HaEpi cells, followed by treatment with 20E (2 μM) for 6 h. dsGFP and DMSO were used as negative controls. All of the relative mRNA levels were calculated by 2–∆∆CT, and the bars indicate the mean ± SD. Significant differences were calculated using Student’s t test (*P < 0.05) according to three biological replicates and three technical replicates in all qRT-PCRs.

