Fig. 4.
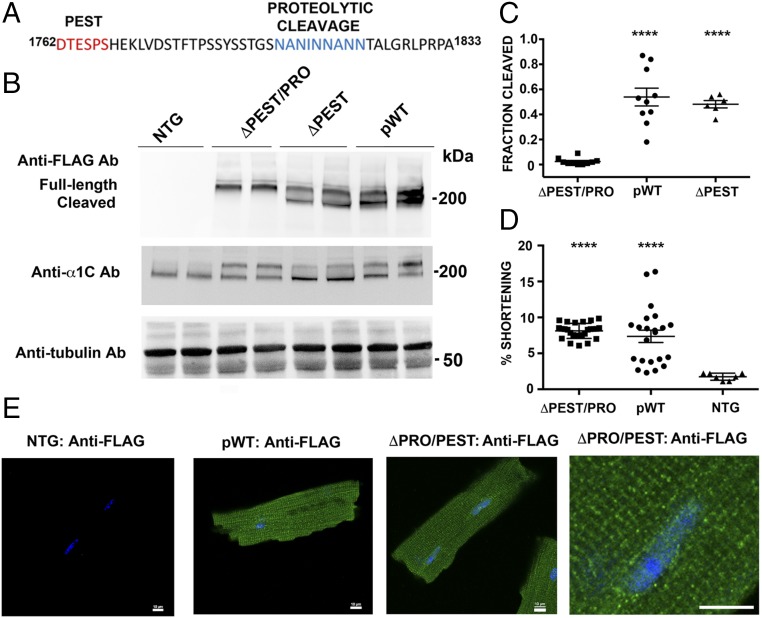
Identification of C-terminal proteolytic cleavage of α1C. (A) Sequence of PEST and proteolytic cleavage site of rabbit α1C. (B) Anti-FLAG antibody (Ab; Upper), anti-α1C antibody (Middle), and antitubulin antibody (Lower) immunoblots showing FLAG epitope-tagged α1C expression in isolated cardiomyocytes from nontransgenic (NTG), pWT α1C, ΔPEST α1C, and ΔPEST/PRO α1C transgenic mice. (C) Bar graph of densitometries of cleaved α1C band divided by truncated + full-length α1C bands (n = 10 pWT α1C mice, n = 6 ΔPEST α1C mice, and n = 10 ΔPEST/PRO α1C mice; P < 0.0001 by ANOVA, ****P < 0.0001 by Tukey’s multiple comparison test). (D) Percent shortening of sarcomere length after incubation and superfusion of 300 nM nisoldipine-containing solution. Cardiomyocytes were field-stimulated at 1 Hz (P < 0.0001 by ANOVA and Tukey’s multiple comparison test). (E) Immunostaining of ΔPEST/PRO cardiomyocytes. Anti-FLAG antibody, FITC-conjugated secondary antibody, and nuclear labeling with Hoechst stain are shown. Images were obtained with a confocal microscope at 40× magnification. (Scale bar: 10 μm.)

