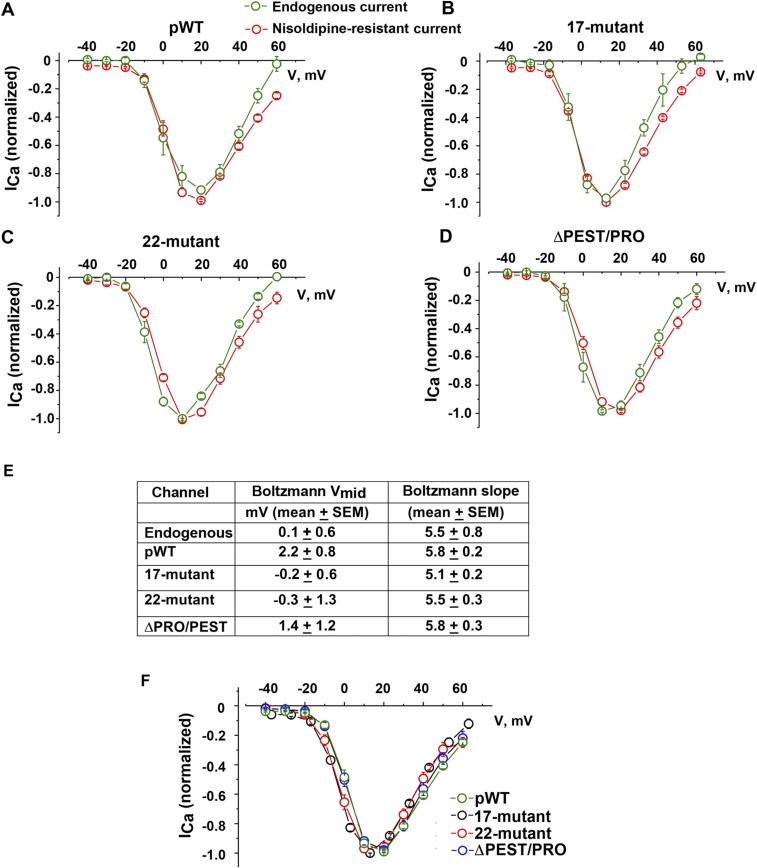
Fig. S2.
I-V relationships for transgenic CaV1.2 channels and endogenous CaV1.2 channels are not different. Normalized I-V relationships of Ca2+ currents (ICa) recorded from pWT α1C (A), 17-mutant α1C (B), 22-mutant α1C (C), and ΔPEST/PRO α1C (D). Whole-cell CaV1.2 currents were recorded from a series of pulses between −40 mV and +60 mV from a holding potential of −70 mV before and 3 min after superfusion of 300 nM nisoldipine (red trace). I-V curve of endogenous CaV1.2 (green trace) was derived by subtracting nisoldipine-resistant current from the total CaV1.2 current. Mean ± SEM (pWT, n = 10; 17-mutant, n = 7; 22-mutant, n = 8; ΔPEST/PRO, n = 4). (E) Table of Boltzmann function, midpoint (Vmid), and slope for endogenous Ca2+ channels and nisoldipine-resistant mutant transgenic Ca2+ channels [P = not significant by ANOVA (P = 0.30); endogenous channels, n = 11; pWT, n = 8; 17-mutant, n = 12; 22-mutant, n = 10; ΔPRO/PEST, n = 11]. (F) Normalized I-V relationship of nisoldipine-resistant current of pWT, 17-mutant, 22-mutant, and ΔPEST/PRO. Mean ± SEM.

