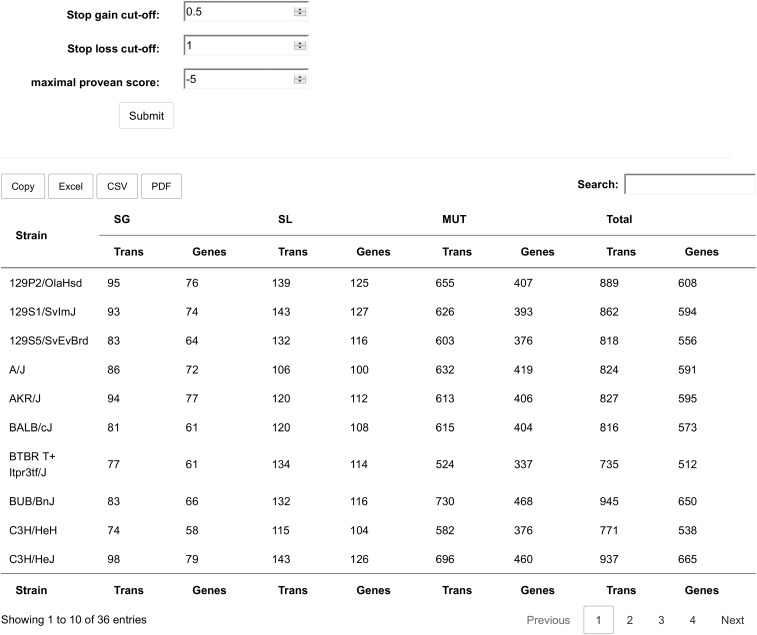
Fig. S2.
After changing the cutoffs, the table is updated to show the number of genes that pass the new filters. The table can be exported to the clipboard, an excel file, a csv file of a pdf file using the buttons above the table. The search field may be used to quickly select a strain of interest. Each number in the table is a link to a different part of the website in which a list of the actual genes affected for each strain an class may be obtained. The filter settings entered here will be taken into account when generating those lists.

