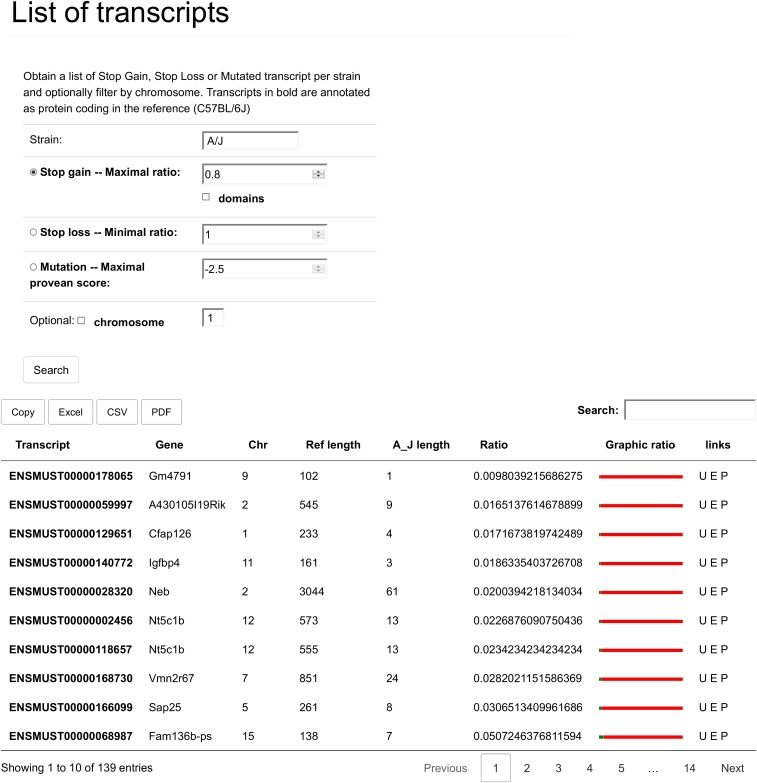
Fig. S4.
This is the output that is generated for SG in the strain A/J, with a minimal loss of 20% of the reference sequence. There are eight columns. The first two specify the affected transcript and gene, respectively, and link to a details page, where all the information about this gene may be found. Then there is the chromosome where the gene is located, and the following four columns have to do with the length and length difference between the reference C57BL/6J strain and the strain of interest (here A/J). The “Ref length” shows how long the protein encoded by this transcript is in the reference strain. The “A/J length” column shows how long the protein is in the strain of interest, taking the early stop codon into account. The “ratio” column shows the ratio between “A/J length” and “Ref length.” By default, the table is also ordered on this column from largest difference to smallest. The “Graphic ration” shows an image-based representation of the length difference, where the red color stands for sequence lost. The final column is a set of links to Ensembl (E); University of California, Santa Cruz, genome browser (U); and PubMed (P). These link to ensemble transcript information, a view of the transcript on the genome browser, and a PubMed search of the gene, respectively. The data can also be exported, but because of limitations of the export library, the “Graphic ratio” and “Links” are not included when doing so. In the case that SL is selected, the table has the same fields as the one show here. The difference is only in the sorting (from largest relative extension to smallest) and in the interpretation of the “Graphic ratio,” where the red then becomes the amount of sequence added to the normal protein length.

