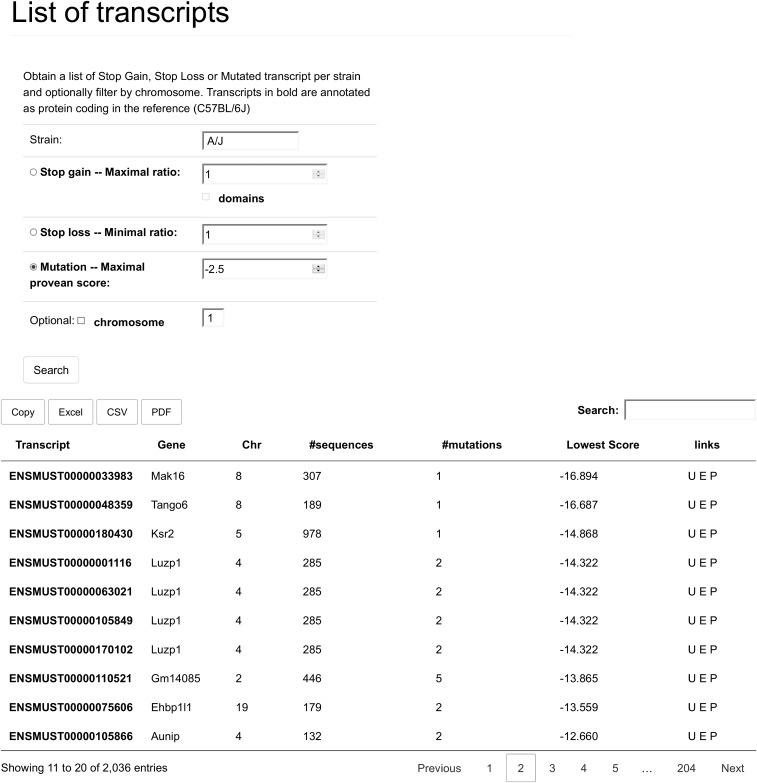
Fig. S5.
The table obtained when listing the MUT events differs lightly from the SL and SG tables. The “Transcrip,” “Gene,” “Chr,” and “links” columns are the same; see Fig. S4 for the explanation. The fourth column here is the “#sequences” column. This shows the number of supporting sequences PROVEAN used to calculate it’s score. This is a quality metric for the prediction, and values lower than 50 in this field indicate that the PROVEAN score may not be reliable. “#mutations” indicates how many mutations are present in the transcript. “Lowes Scores” shows the score of the mutation with the lowest PROVEAN score in the protein encoded by this transcript. The table is also sorted on this field.

