Fig. 5.
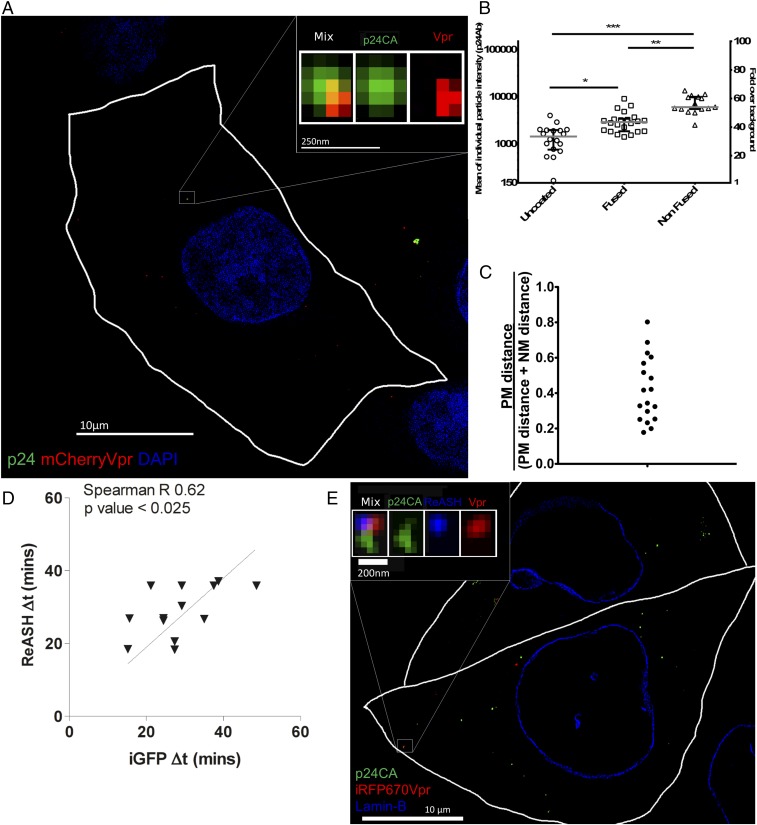
Quantification of CA in viral complexes links capsid integrity loss to uncoating. (A) Three-dimensional SIM superresolution imaging of cells fixed after live imaging for 40 min. (Scale bar: 10 μm.) (Inset) Particle that showed two drops and complete GFP signal loss shows a positive signal for CA (green) and Vpr (red), using nuclear staining with DAPI (blue). (Scale bar: 250 nm.) (B) Mean intensity and signal-to-noise ratio of all live-imaged individual particles. Groups were defined by their live-imaging GFP capsid integrity phenotype. Medians of the individual events are represented by the gray bars, and interquartile ranges are shown as error bars. (C) Particles with a complete loss of capsid integrity locate in the cytoplasm after measurement of the distance from the particle to plasma and nuclear membranes [value of 1 means nuclear membrane location, value of 0 means located at the plasma membrane (PM)]. (D) HIV-iGFP-ReAsH-iRFP670Vpr particles were plotted by timing of complete loss of GFP (x axis) and timing of complete loss of ReAsH signal (y axis). (E) Three-dimensional SIM superresolution imaging of cells that were fixed after live imaging for 45 min: p24 (green), Lamin-B (blue), and iRFP670Vpr (red). (Scale bar, 10 μm.) (Inset) Magnification represents a particle where two intensity drops were observed, resulting in a complete loss of GFP signal. An uncoated particle fixed after live imaging that is positive for p24 (green), CA-ReAsH (blue), and iRFP670Vpr (red) is shown (Scale bar: 200 nm.) *P < 0.5; **P < 0.1; ***P < 0.01.

