Fig. 6.
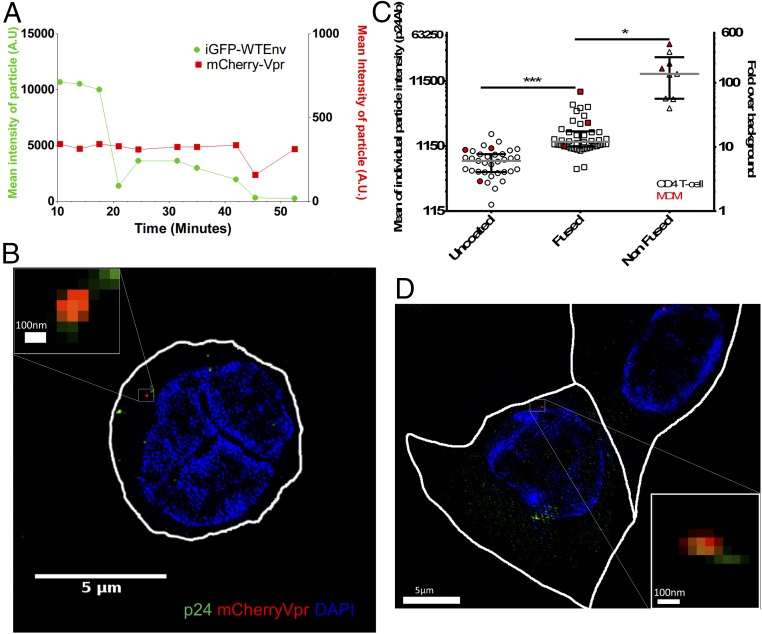
Quantification of CA in viral complexes in primary cells shows a loss of CA after capsid integrity loss. (A) Mean particle intensity of GFP signal (green) and mCherryVpr (red) of an individually tracked, dual-labeled HIV-1 particle; the sample was fixed at 55 min and represents the same event as in B. (B) Three-dimensional SIM superresolution imaging of a CD4 T cell fixed after live imaging for 55 min. (Scale bar: 5 μm.) (Inset) Particle that showed two drops and complete GFP signal loss shows a positive signal for CA (green) and Vpr (red), using nuclear staining with DAPI (blue) and cytoplasmic localization. (Scale bar: 100 nm.) (C) Mean intensity and signal-to-noise ratio of all live-imaged particles that were individually tracked. Groups were defined by their live-imaging GFP capsid integrity phenotype. Medians of the individual events are represented by gray bars, and interquartile ranges are shown as error bars. Open symbols show particles that challenged CD4 T cells, and red symbols show representative events measured from MDMs. (D) Three-dimensional SIM superresolution imaging of an MDM that was fixed after live imaging for 50 min. (Scale bar: 5 μm.) (Inset) Particle that showed two drops and complete GFP signal loss shows a positive signal for CA (green) and Vpr (red), using nuclear staining with DAPI (blue) and cytoplasmic localization. (Scale bar: 100 nm.) *P < 0.5; ***P < 0.01.

