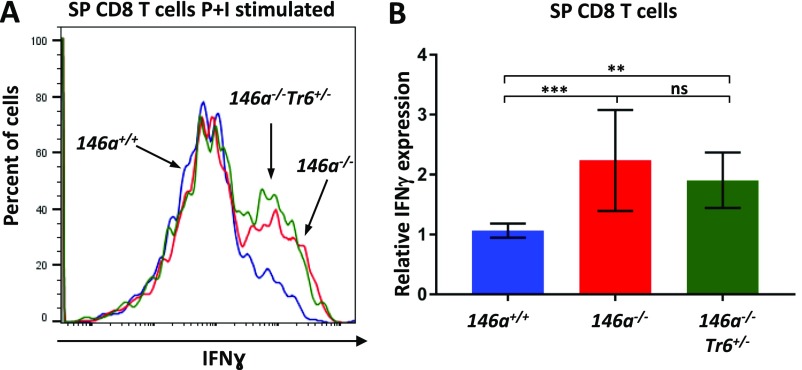
Fig. S3.
IFN-γ expression in stimulated splenic T lymphocytes. FACS analysis of IFN-γ production by CD8+ T cells isolated from miR-146+/+, miR-146a−/−, miR-146a−/−Traf6+/− spleens. Splenocytes harvested from 12- to 14-wk-old female mice were stimulated with phorbol 12-myristate 13-acetate and ionomycin for 4 h and analyzed by flow cytometry for intracellular IFN-γ expression. Representative FACS plots showing IFN-γ expression in CD8+ T (A) cells from miR-146+/+, miR-146a−/−, and miR-146a−/−Traf6−/+ spleens. (B) Quantification of intracellular IFN-γ expression in stimulated CD8+ T cells from miR-146+/+, miR-146a−/−, and miR-146a−/−Traf6+/− spleens. IFN-γ MFI values were calculated using the FlowJo X software and then were normalized to miR-146+/+ samples. Data are representative of at least two different experiments with n ≥ 3 for each genotype. Data are shown as mean ± SD. P values were calculated using standard one-way ANOVA tests. **P ≤ 0.01; ***P ≤ 0.001; ns, not significant; P+I, phorbol 12-myristate 13-acetate and ionomycin.

