Fig. S3.
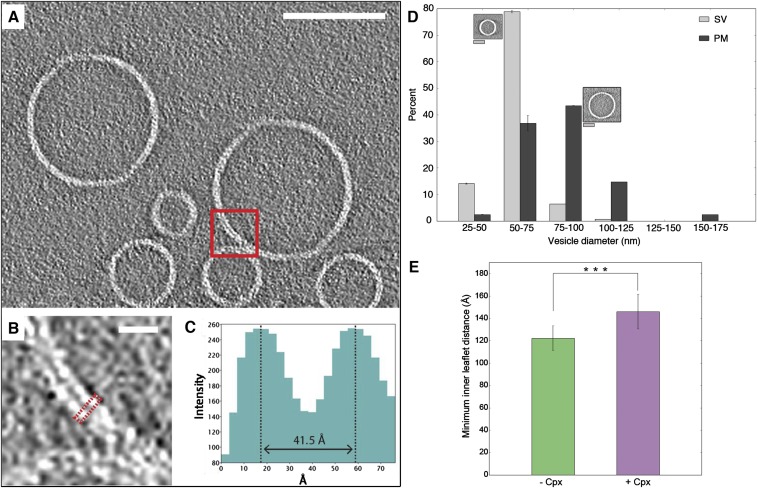
Vesicle and membrane analysis. (A–C) Bilayer thickness measurement. (A) The lipid bilayer thickness measurement was performed for the selected region (red box) using a VPP tomographic 2D slice of a mixture of SV + PM vesicles. (Scale bar: 100 nm.) (B) Close-up view of the selected region. (Scale bar: 10 nm.) (C) Line plot of the density across the bilayer (red dotted box in B). The bilayer thickness was estimated from the peak-to-peak distance. Tomogram 2D slice thickness: 1 pixel = 3.42 Å. (D) Bar chart of vesicle diameter distributions of individual SV (light gray) vesicles and PM (dark gray) vesicles. The majority of the individual SV vesicles have a diameter of 55 nm whereas the majority of the individual PM vesicles have a diameter of 90 nm. Representative images of SV and PM vesicles shown next to the two top bars. (Gray scale bar: 25 nm.) (E) Inner leaflet distance with and without Cpx. The bar graph shows the average and SD for the minimum distance between inner leaflets at contact sites between vesicles in the absence and presence of Cpx. Means and SDs are shown (146 ± 16 Å in the presence of Cpx and 122 ± 11 Å in the absence of Cpx). Statistical significance was assessed by Student’s t test (***P < 0.001).

