Fig. S7.
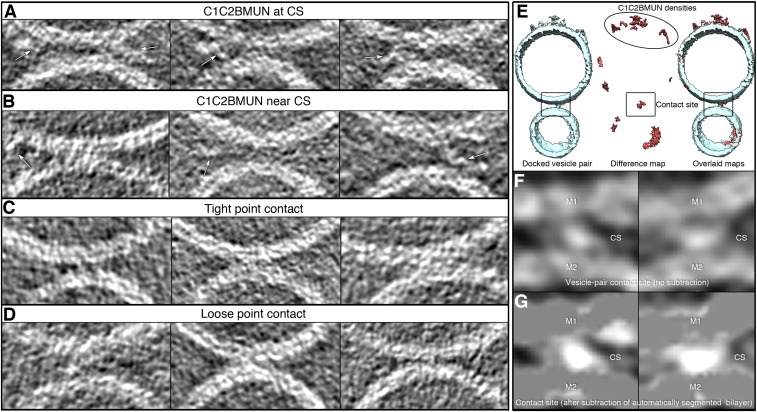
Contact sites of SVCpx + PMC1C2BMUN vesicles and difference map analysis. (A–D) Representative gray scale tomographic 2D-slice views of contact sites, in addition to those shown in Fig. 3. Some of the C1C2BMUN fragments are indicated by arrows. The left, center, and right panels show three examples of the particular contact site. Tomogram 2D slice thickness: 1 pixel = 3.42 Å. (E–G) Difference map analysis. (E, Left) A docked SVCpx + PMC1C2BMUN vesicle pair (blue). (Middle) A difference map (red) obtained after bilayer subtraction. (Right) A superposition of the difference map and the segmentation of the subtomogram. All maps are shown in isosurface representation. (F and G) Gray scale tomographic 2D slices of the contact site (CS) observed in the docked SVCpx + PMC1C2BMUN vesicle pair shown in A along the XZ/XY directions (relative to the tomogram axis) before and after subtraction of the two membranes (M1 and M2), respectively. F shows a contact site with no bilayer subtraction in two orthogonal views (left and right panels). G shows the same contact site as in F after bilayer subtraction in the same orthogonal views. A video of the contact site analysis is available in Movie S1.

