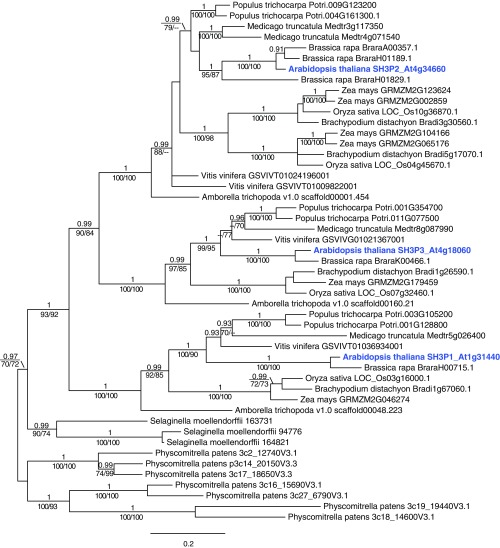
Fig. S1.
Phylogenetic analysis of SH3Ps. A Bayesian tree was deduced from CDS homologous to Arabidopsis SH3P1, SH3P2, and SH3P3. Values above branches indicate posterior probabilities (≥0.9) calculated by Bayesian analysis, and those below branches indicate bootstrap values of ML (Left) and MP (Right) (≥70). Bold blue font indicates the SH3P genes of Arabidopsis thaliana.

