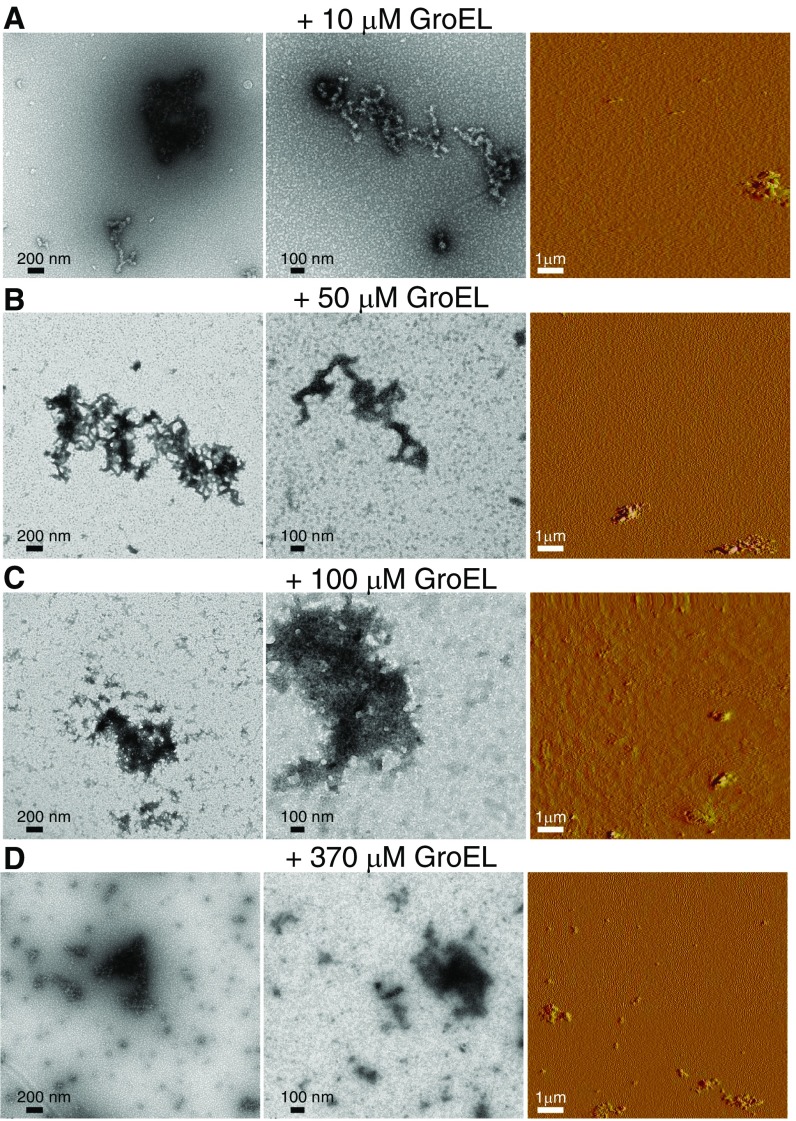
Fig. S1.
Negative stain electron micrographs (Left and Center) and amplitude AFM images (Right) of Het-s protofibrils obtained immediately after addition of GroEL at different concentrations. Ten (A), 50 (B), 100 (C), and 370 (D) micromolar (in subunits) GroEL was added to 100 μM Het-s(218–289) monomer.

