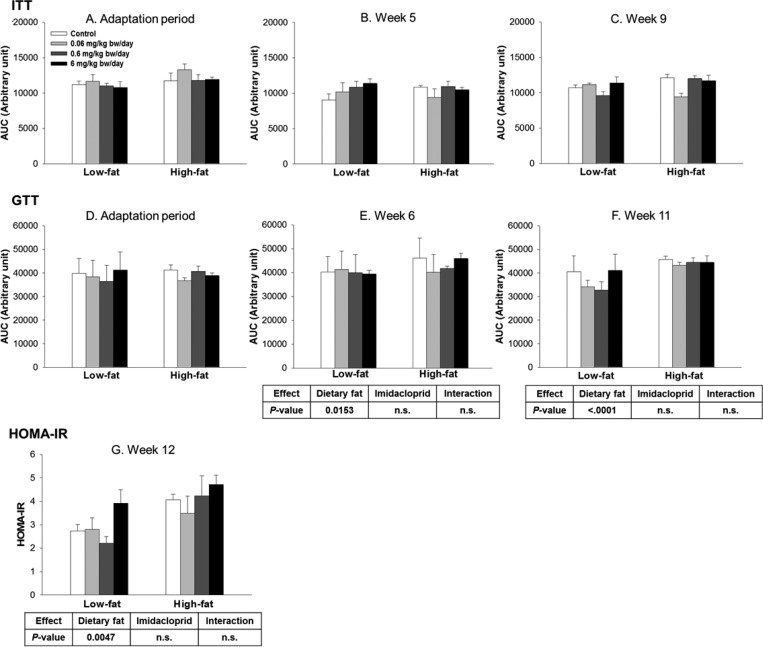
Figure 2.
Effects of imidacloprid on insulin tolerance test (ITT) (A–C) and glucose tolerance test (GTT) (D–F) as determined as the area under the curve (AUC) and HOMA-IR (G). Mice were fed a low or high fat diet supplemented with imidacloprid (0, 0.06, 0.6, and 6 mg/kg bw/day) for 12 weeks. ITT was measured during the adaptation period and weeks 5 and 9. GTT was measured during the adaptation period and weeks 6 and 11. Blood was collected from the tail vein, and glucose levels were determined at 0 min. Insulin (ITT) or glucose solutions (GTT) were subsequently administered by intraperitoneal injection, and the glucose level was further measured at 15, 30, 60, and 120 min post-injection. HOMA-IR score was calculated at week 12 with a HOMA-IR calculator. Numbers represent means ± SE (n = 5–8).

