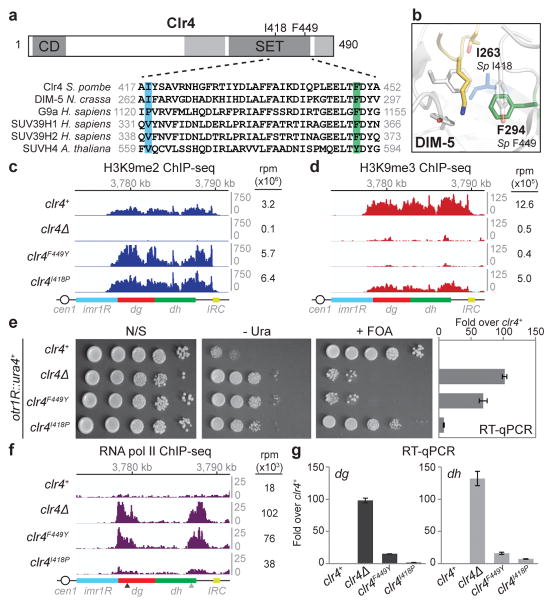
Figure 1. Clr4 SET domain mutations that block H3K9me3 result in defective TGS.
a, Diagram illustrating location of the Clr4 chromo (CD) and SET domains, and the mutations used in this study (top). Sequence alignment for the SET domain region containing these mutations in the indicated methyltransferases (bottom). b, Crystal structure of N. crassa DIM-5 catalytic pocket in complex with a histone H3 N-terminal peptide (yellow), showing side chain of lysine 9 in the catalytic pocket. DIM-5 F294 (corresponding to S. pombe F449) is depicted in green; DIM-5 I263 (corresponding to S. pombe I418) is depicted in blue (PDB ID: 1PEG)29. c, H3K9me2 ChIP-seq reads mapped to the pericentromeric repeat regions on the right arm of chromosome 1 in clr4Δ, clr4+, clr4F449Y, and clr4I418P cells. Location of centromere 1 (cen1), innermost repeats (imr1R), outermost dg and dh repeats, and inverted repeat centromere (IRC) sequences are indicated. Top: Chromosome 1 coordinates. Right: sum of normalized reads mapping to chromosome 1 pericentromeric regions. Reads were randomly assigned to the dg and dh repeats of each chromosome and are presented as reads per million (rpm, Y axis). d, Same as c but showing H3K9me3 ChIP-seq reads. e, Left: otr1R::ura4+ transgene silencing assay (see Extended Data Fig. 4a for insert location). N/S, non-selective medium; - Ura, minus uracil medium; + FOA, 5-FOA-containing medium. Image represents 3 individual experiments. Right: RT-qPCR analysis of otr1R::ura4+ transcript. Error bars, s.d.; n = 3 biological replicates. f, Same as c, but showing pol II ChIP-seq reads. Arrowheads indicate primer locations for ChIP-qPCR analysis (see Extended Data Fig. 4). g, RT-qPCR analysis of dg and dh transcripts. Values are shown as fold increase in RNA levels in mutant over clr4+ cells. Error bars, s.d.; n = 3 biological replicates.

