
Extended Data Figure 4. ChIP-qPCR analysis showing increased pol II levels at pericentromeric DNA repeats of clr4 mutant cells.
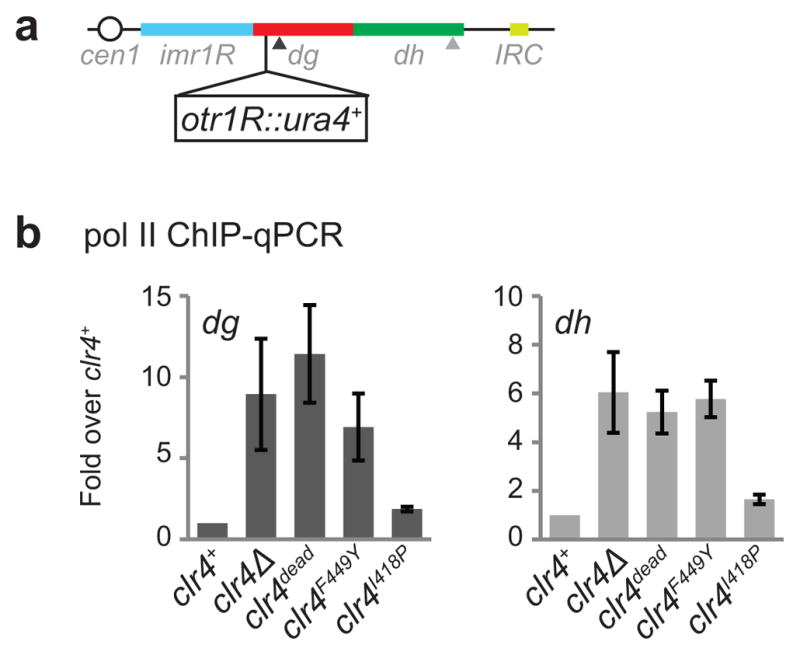
a, Map showing the location of the heterochromatin reporter ura4+ inserted to the right of cen1. b, ChIP-qPCR data showing changes in the association of RNA pol II with the dg and dh pericentromeric DNA repeats in clr4 mutant cells. qPCR primer locations are indicated by arrowheads in a. Error bars, s.d.; n = 3 biological replicates.