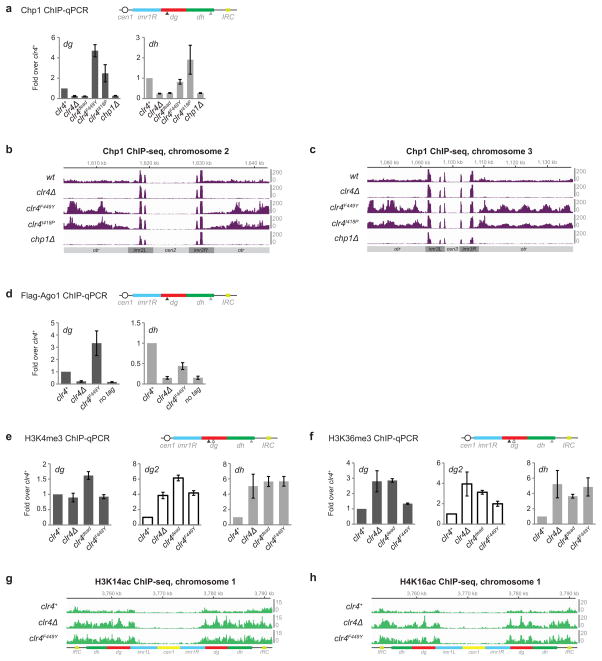
Extended Data Figure 5. Clr4 mutant cells have increased levels of Chp1 and activating histone marks at pericentromeric DNA repeats.
a, ChIP-qPCR showing increased Chp1 recruitment to pericentromeric DNA repeats. Error bars, s.d.; n = 3 biological replicates. b, ChIP-seq data showing increased Chp1 reads mapping to pericentromeric regions of chromosome 2 in clr4F449Y and clr4I418P mutants compared to wild-type (wt) cells. c, Same as b, but showing pericentromeric regions of chromosome 3. d, ChIP-qPCR analysis of Flag-Ago1 recruitment to pericentromeric DNA repeats in wild-type clr4+ and clr4F449Y cells. Error bars, s.d.; n = 3 biological replicates. e–h, ChIP-qPCR analysis of H3K4me3 (e) and H3K36me3 (f) levels at pericentromeric DNA repeats in wild-type clr4+ and clr4 mutant cells. dg2 primer location is indicated by empty arrowhead. Error bars, s.d.; n = 3 biological replicates. g, ChIP-seq data showing increased H3K14ac mapped reads at pericentromeric regions of chromosome 1 in clr4F449Y cells. h, ChIP-seq data showing increased H4K16ac mapped reads at pericentromeric regions of chromosome 1 in clr4F449Y cells. Data is presented as reads per million (Y axis).

