
Figure 2.
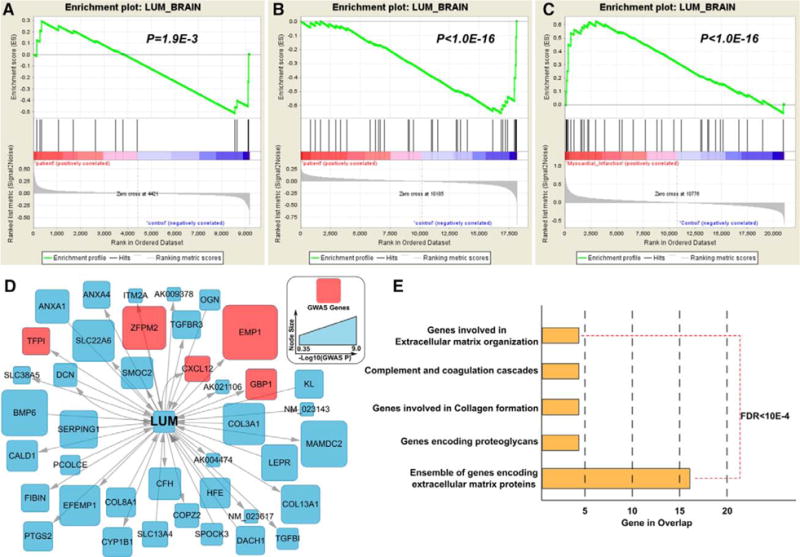
Gene expression perturbations of LUM subnetwork in brain tissue in myocardial infarction (MI) patients. The gene set enrichment analysis revealed significant gene expression perturbation in the LUM subnetwork in T cells (A), resting monocytes (B), and endothelial cells (C) in MI cases. Plots for the 7 nonsignificant cell or tissue types are not shown, but results are available in Table IV in the online-only Data Supplement. The red nodes in the LUM subnetwork (D) are coronary artery disease (CAD) genes from CAD extend list. Pathway analysis for the LUM subnetwork was performed using the Database for Annotation, Visualization and Integrated Discovery (DAVID), with all the pathways satisfying false discovery rate (FDR) <10e−4 (E).