
Figure 3.
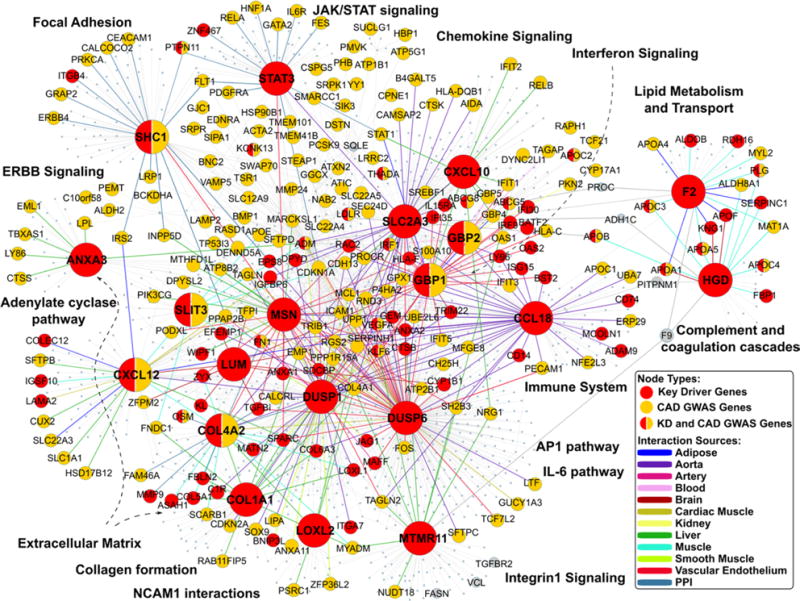
Top key driver (KD) subnetworks in tissue-specific gene regulatory and protein–protein interaction (PPI) networks. The largest nodes are the top 20 KDs. The nodes highlighted in red are KDs, whereas the yellow nodes are the coronary artery disease (CAD) genome-wide association studie (GWAS) genes. KDs that are also CAD GWAS genes are labeled half red and half yellow. The edge colors between genes denote the tissue or network sources of gene–gene interactions. JAK-STAT indicates Janus kinase-signal transducers and activators of transcription.