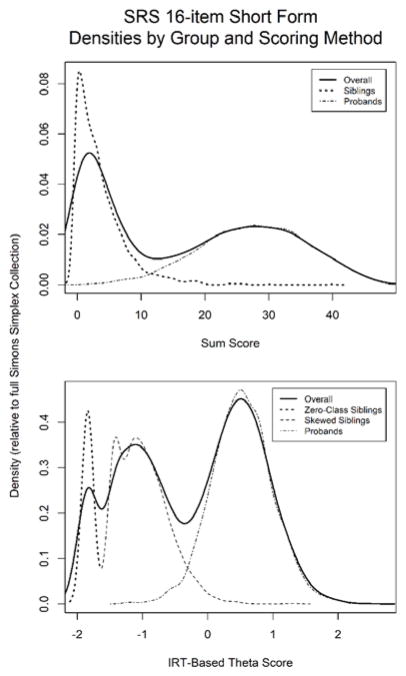
Figure 1. SRS Short Form Score Densities in the Simons Simplex Collection.
Score densities (i.e., proportion of the total sample with a given score) on the 16-item SRS short form are provided for the Simons Simplex Collection (probands n=2630; siblings n=2273). Panel 1a expresses the observed sum score distribution. Panel 1b illustrates the distribution of the IRT-based latent-trait expected a posteriori (EAP) (which is akin to a factor score in factor analysis). Both panels are clearly multi-modal, violating the assumption of an underlying latent normal distribution for the population, which results in the inadequacy of means and standard deviations for describing scores that are only ordinal (not interval or ratio) in nature. In both panels, the solid line is the overall sample density. In Panel 1a, the dotted line is for siblings and the dot-dash line represents probands. In Panel 1b, the dotted line shows the zero-class for siblings, the dashed line is the skewed distribution of siblings, and the dot-dash line represents the relatively normal distribution for probands.

