
Figure 6.
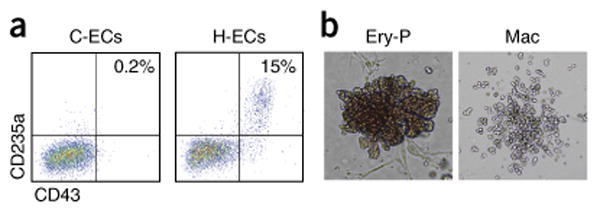
Hematopoiesis assays from hESC-ECs. (a) Representative FACS plot of day 5 C-ECs and H-ECs showing differences in primitive hematopoietic activity, indicated by CD43/CD235a double-positive cells. (b) Representative images of primitive erythroid (Ery-P) and macrophage (Mac) colonies in methylcellulose colony-forming assays. Images are magnified for Ery-P (100×) and Mac (50×) to show details of colony morphology.