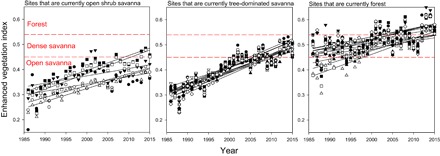
Fig. 1. Historical changes in EVI over 30 years of fire suppression.

Historical changes in the EVI over 30 years of fire suppression, as determined by Landsat images. Each study plot is denoted by a different symbol and a separate regression line.

Historical changes in the EVI over 30 years of fire suppression, as determined by Landsat images. Each study plot is denoted by a different symbol and a separate regression line.