
Figure 5. Protein levels of LP-BER associated proteins are heavily reduced in neurons resulting in a decrease in LP-BER capacity.
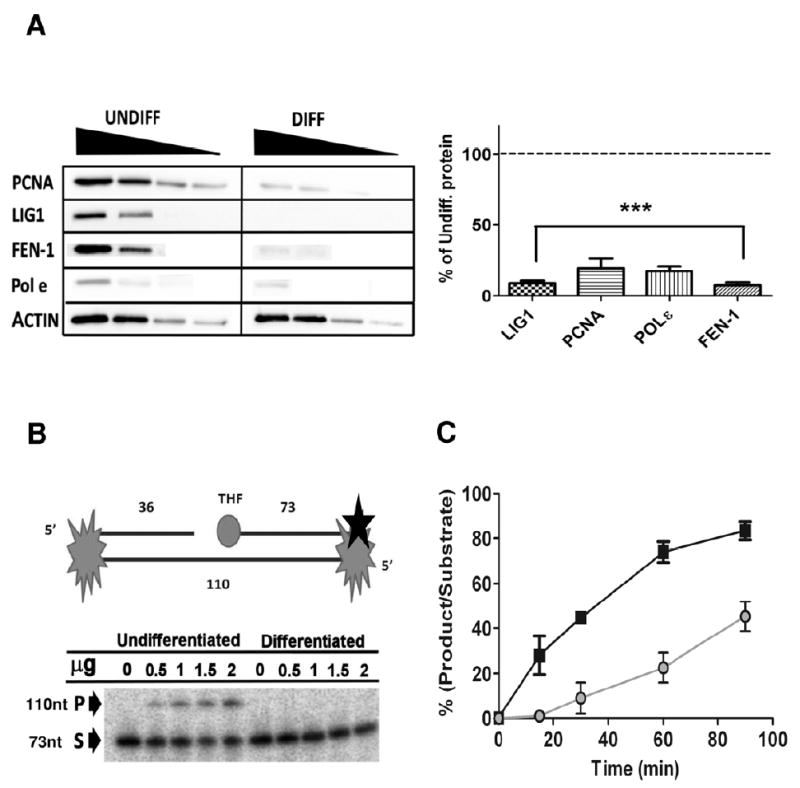
(A) (Left panel) Representative western blot using 80, 40, 20 and 10 μg of total protein extracts. (Right panel) All LPBER proteins investigated were significantly reduced after differentiation. (***, p<0.01, n=3) (B) (Upper) Diagrammatic representation of LP-BER substrate (refer to materials and methods for additional information) Black star denotes 3’ radiolabeling site. (Lower panel) Representative gel of LP-BER substrate using increasing total protein concentrations (0-2 μg) shows no LP-BER activity in differentiated extracts after 15 minutes incubation (P= product, S= substrate). (C) Time course for LP-BER assay demonstrates that LP-BER activity in undifferentiated total cell extracts is significantly (p<0.01, n=3) higher at all-time points investigated (■ denotes differentiated cells, ● denotes undifferentiated cells). Data is mean±SD.