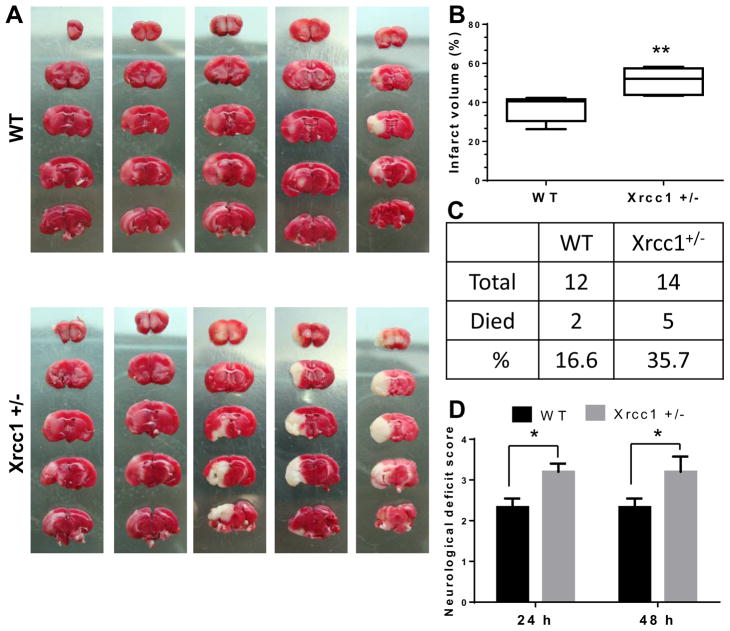
Figure 1.
Infarct volume, mortality rate, and neurological deficit after middle cerebral artery occlusion/ reperfusion (MCAO/R) in WT and Xrcc1 +/− mice. (A) Mouse brain sections stained with 2,3,5-triphenyltetrazolium chloride (TTC) after 48 h of MCAO/R. (B) Quantification of the infarct volume shown in A. The data are presented as a box plot diagram, which represents the minimum to maximum distribution of the average percentage of infarct volume ± SEM. (C) Percentage of death in mice within 48 h of the MCAO/R procedure. (D) Graphic of the assigned neurological deficit score at 24 and 48 h after the MCAO/R procedure. Data are presented as means ± SEM. Statistical analysis was performed by one-way ANOVA followed by Bonferroni’s post-hoc test for pairwise comparisons, *p<0.05, **p<0.01.

