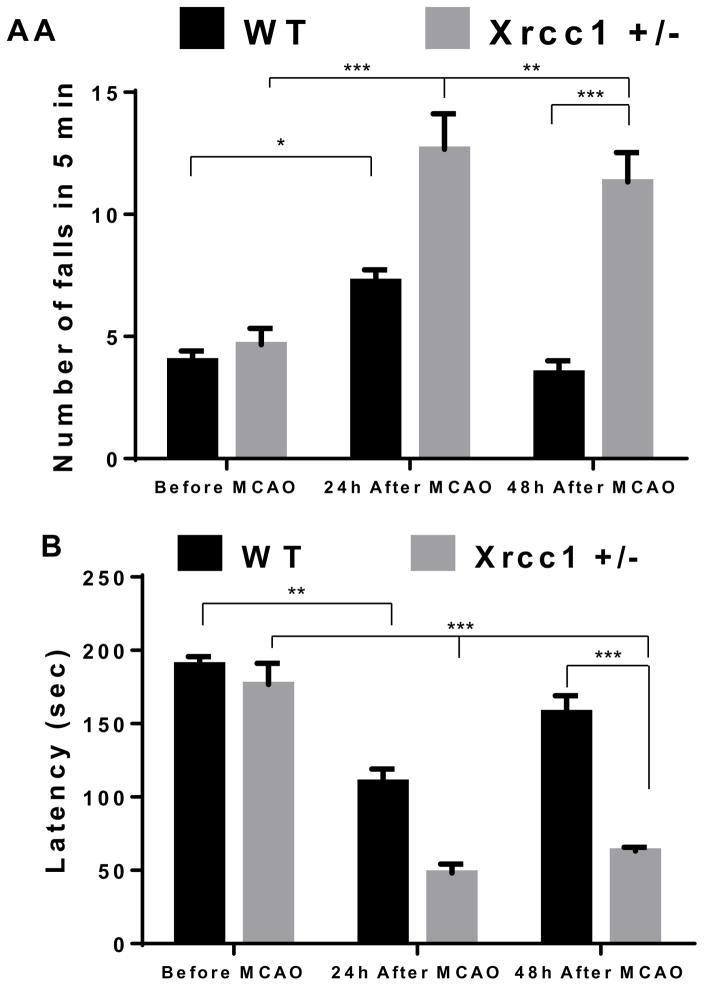
Figure 2.
Motor dysfunction in Xrcc1 +/− and WT mice before and after middle cerebral artery occlusion/ reperfusion (MCAO/R). (A) Average number of falls and (B) average latency of first fall measured during rotarod test. Data indicate average ± SEM, where the sample size is WT, n = 4 and Xrcc1 +/− n = 3. A two-way ANOVA followed by Bonferroni’s correction as well as LSD was used to analyze the data. Asterisks denote the various p-values as follows: *, p≤0.024; **p≤0.001; *** p≤0.0001..

