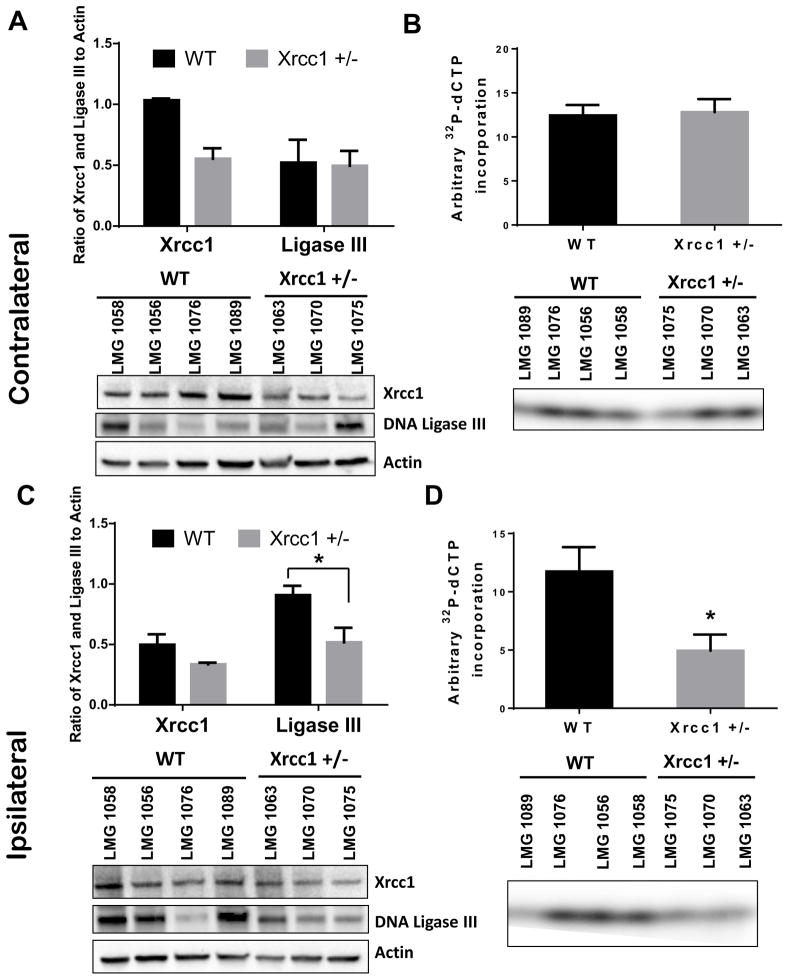
Figure 4.
Expression of Xrcc1 & DNA Ligase III and whole BER activity in Xrcc1 +/− mouse brains after middle cerebral artery occlusion/ reperfusion (MCAO/R). (A) A representative immunoblot of Xrcc1 and Ligase III levels in whole brain lysates of contralateral area of the stroked brains. The graph indicates the quantitation of Xrcc1 and ligase III levels shown in the blot normalized to the actin levels. Data were averaged from 4 or 3 mice and at least two independent experiments. (B) Relative dCTP incorporation and ligation into a 91-mer in whole brain lysates of contralateral area of the stroked brains. Data indicate average ± SEM (*p<0.05 using a two-tailed Student's t-test with a sample size of n = 4 for WT and n = 3 for Xrcc1 +/−). (C) A representative immunoblot of Xrcc1 and Ligase III levels in whole brain lysates of ipsilateral area of the brains. The graph indicates the quantitation of Xrcc1 and ligase III levels shown in the blot normalized to the actin levels. Data were represented from at least two experiments. (D) Relative dCTP incorporation and ligation into a 91-mer in whole brain lysates of ipsilateral area of the brains. Data indicate average ± SEM.

