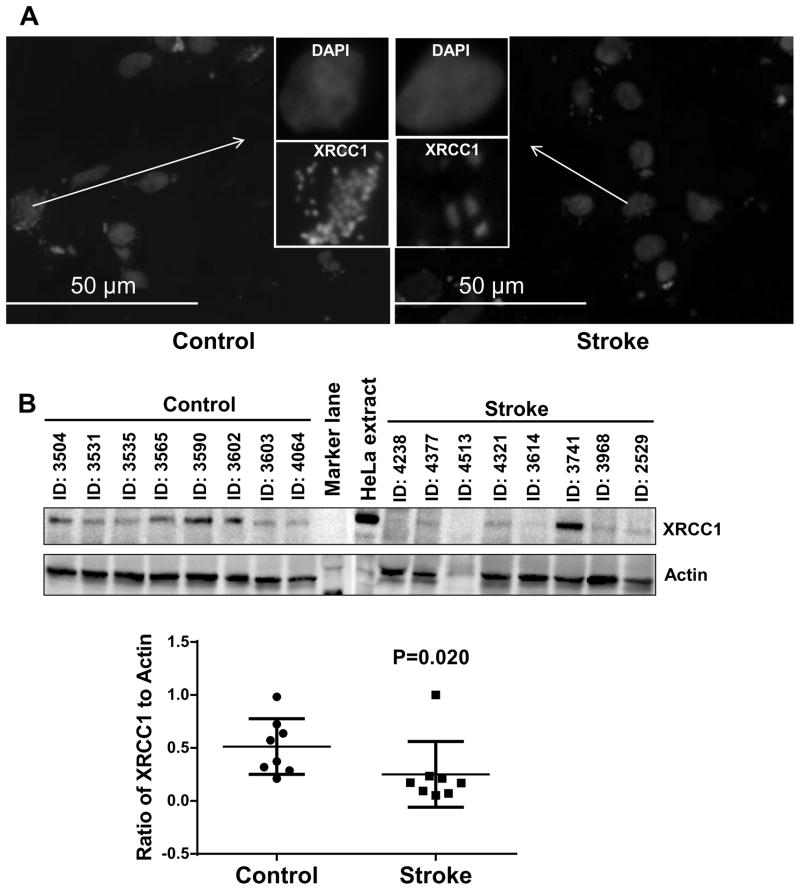
Figure 6.
XRCC1 expression in control and stroke human brain samples. (A) Representative image of Immunofluorescence staining of XRCC1 in control and stroke human brain samples, n=8 (Insert) image of a single cell is enlarged to show the expression of XRCC1. (B) A representative immunoblot of XRCC1 levels in control and stroke human brain samples. The graph indicates the quantitation of XRCC1 levels shown in the blot normalized to the actin levels. The data are represented by mean ± SD, n = 8.

