FIGURE 3:
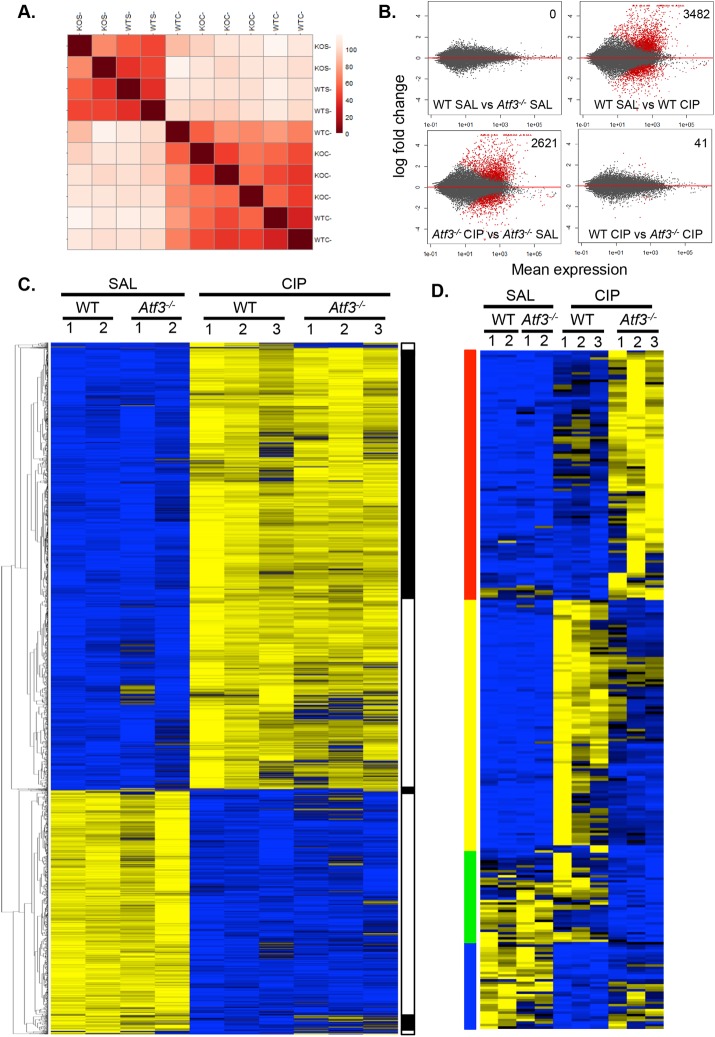
Lack of ATF3 alters the molecular response to CIP. (A) Distance correlation heat map comparing global gene expression in male WT and Atf3–/– mice treated with saline (SAL; n = 2) or cerulein (CIP; n = 3). (B) MA plots for global gene expression of the four different conditions in the RNA-seq; significantly differentially expressed genes (p-adj < 0.01) are indicated in red. Number of differentially expressed genes is indicated in the top right. (C) Heat maps comparing gene expression differences between WT and Atf3–/– pancreatic tissue 4 h into saline or cerulein treatment identified seven ill-defined gene clusters based on similar changes in expression (indicated in black and white). (D) Heat maps of genes determined as differentially expressed between WT and Atf3–/– cerulein-treated pancreatic tissue (p < 0.01) identified 274 genes grouped into four clusters based on expression changes, including those that increased only in Atf3–/– (red) or WT tissue (yellow), or decreased only in Atf3–/– (green) or WT tissue (blue) See Supplemental Table S10 for gene lists.

