FIGURE 5:
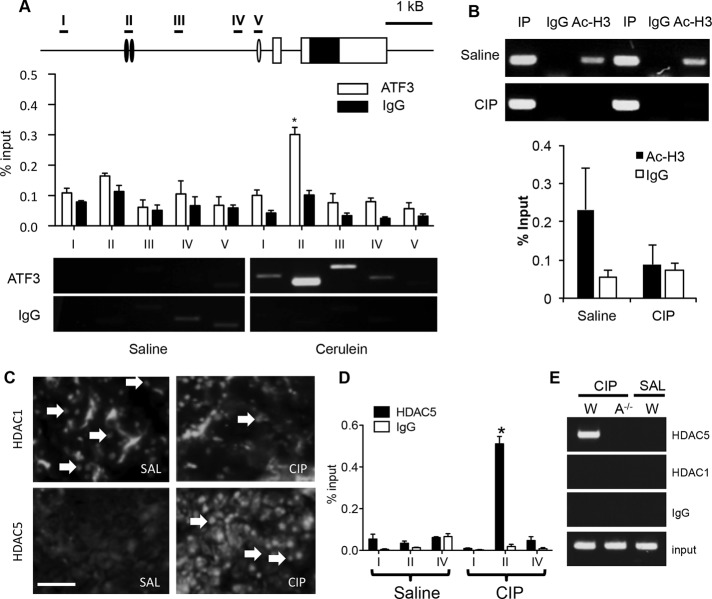
ATF3 represses Mist1 expression in part through recruitment of HDAC5. (A) ChIP-qPCR for ATF3 enrichment along the Mist1 gene shows enrichment specifically at region II (–2500 base pairs relative to the Mist1 TSS) only after induction of CIP (4 h). Representative ChIP-PCR shows ATF3 enrichment at the Mist1 promoter. (B) ChIP-PCR and ChIP-qPCR reveals decreased acetylated H3 (Ac-H3) at the Mist1 promoter 4 h into CIP. Two different saline and CIP samples are shown for ChIP-PCR. (C) IF shows increased nuclear accumulation of HDAC5 at 4 h into CIP (arrows) with no change in HDAC1 accumulation. Bar, 70 μm. (D) ChIP-qPCR for HDAC5 shows enrichment ∼2.5 kb upstream of the Mist1 TSS only after 4 h of CIP treatment. (E) HDAC5 requires ATF3 for recruitment to the Mist1 gene (A–/– = Atf3–/–). *p < 0.05, n = 3 in all cases.

