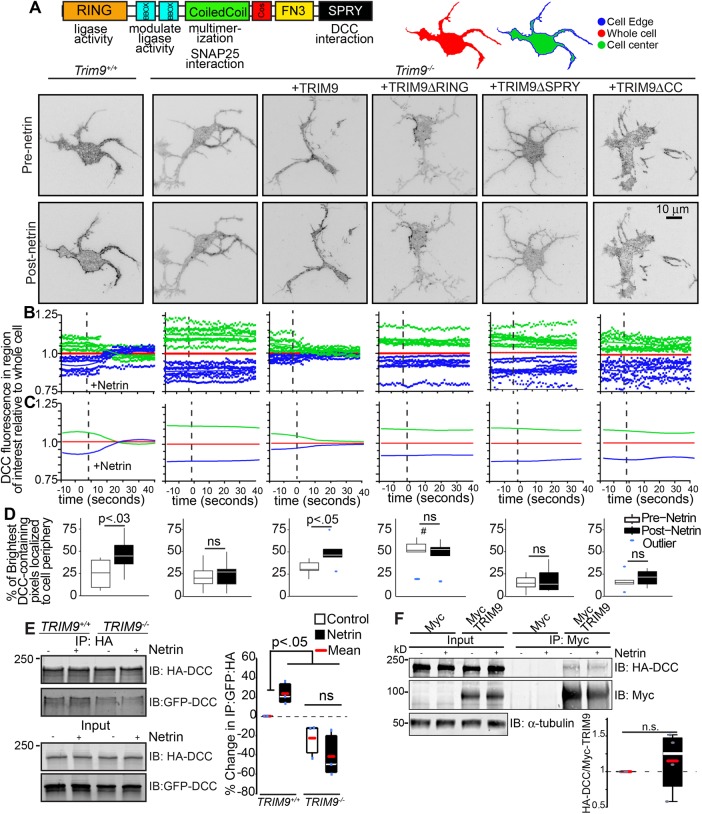
FIGURE 1:
Loss of Trim9 impairs netrin-dependent clustering and multimerization of DCC. (A) Inverted TIRF images of Trim9+/+ and Trim9−/− cortical neurons expressing fluorescently tagged DCC before and after netrin-1 application. Schematics of TRIM9 domain structure and functions (left), and of analysis regions of interest within cell mask, including whole cell (red), cell edge (blue, 0.64 μm) and cell center (green). (B) Graphs of average mean fluorescence of DCC in the denoted ROIs in individual cells over time. Values are normalized to the average intensity of the whole cell. (C) Local polynomial regression of data shown in B demonstrates trends in temporal changes in average DCC fluorescence intensity in each ROI. (D) The percent of the pixels containing the highest 10% of DCC fluorescence intensity in the TIRF illumination field that localize at the cell perimeter. The p values (assessed via two-way ANOVA with Tukey post hoc correction) show differences between each pre– and post–netrin-1 condition. #, p < 0.0005 difference from pre–netrin-1 Trim9+/+. (E) Immunoblot of inputs and immunoprecipitates (IPs) of HA-DCC. Coimmunoprecipitation of GFP-DCC increases following netrin-1 stimulation in TRIM9+/+ cells. The p values were assessed by Kruskal-Wallis ANOVA with LSD post hoc correction. (F) Immunoblot of Myc-TRIM9 and HA-DCC in inputs and IPs of Myc and Myc-TRIM9 in TRIM9+/+ HEK 293 cells. The p values were assessed by Mann-Whitney test.

