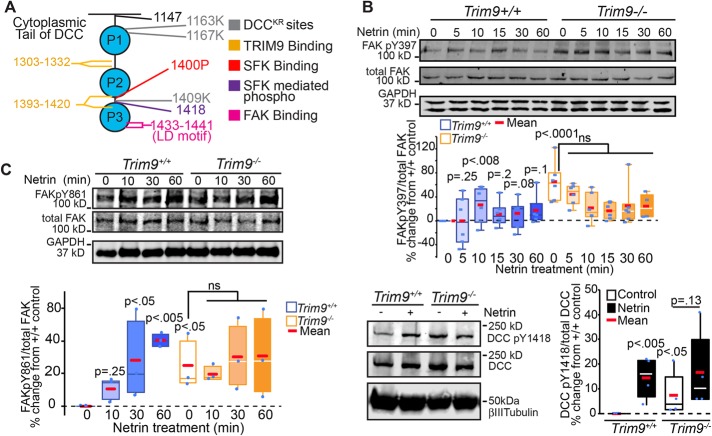
FIGURE 2:
Loss of Trim9 leads to hyperactivation of FAK. (A) Schematic representation of the cytoplasmic tail of DCC showing key mutation and interaction sites. (B) Immunoblots of endogenous total FAK, FAKpY397, and GAPDH from cortical lysate. Quantification of percent change in each phosphorylation event, normalized to total FAK relative to Trim9+/+ neurons. The p values noted are for Kruskal-Wallis ANOVA with LSD post hoc correction to Trim9+/+ control, unless otherwise noted. (C) Immunoblots of endogenous total FAK, FAKpY861, and GAPDH from cortical lysate. Quantification of percent change in each phosphorylation event normalized to total FAK relative to Trim9+/+ neurons. The p values noted are for Kruskal-Wallis ANOVA with LSD post hoc correction to Trim9+/+ control, unless otherwise noted. (D) Immunoblots of endogenous DCC pY1418, DCC, and βIII tubulin in Trim9+/+ and Trim9−/− cortical neurons. Quantification of levels of pY1418/DCC relative to Trim9+/+ neurons. The p values noted are for Kruskal-Wallis ANOVA with LSD post hoc correction, compared with Trim9+/+ control, unless otherwise noted.

