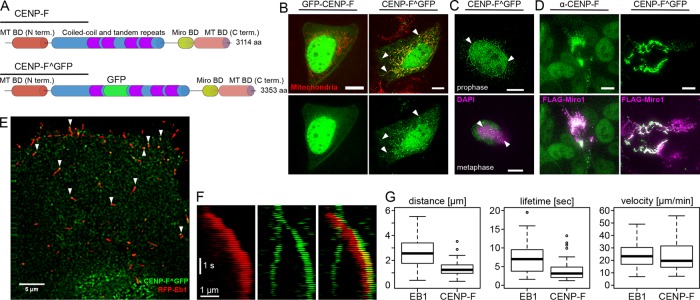
FIGURE 1:
CENP-F tracks growing microtubules in vivo. (A) Top, domain organization of CENP-F. Bottom, position of the internal GFP tag (CENP-F^GFP). (B) Live images of U2OS cells coexpressing N-terminally GFP-tagged CENP-F (GFP-CENP-F, left) or internally GFP-tagged CENP-F (CENP-F^GFP, right) and a mitochondrial marker (mtBFP, red). Arrowheads show mitochondrial localization. Scale bars, 10 µm (C) Top, localization of CENP-F^GFP to the nuclear envelope (arrowheads) in early prophase. DNA is counterstained with 4′,6-diamidino-2-phenylindole (DAPI). Bottom, localization of CENP-F^GFP to the kinetochores (arrowheads). Condensed chromatin is counterstained using an anti-phosphohistone H3 (H3P). Scale bars, 10 µm. (D) Cells overexpressing FLAG-Miro (magenta) and stained for endogenous CENP-F (left, green) or cotransfected with CENP-F^GFP (right, green) show recruitment of both endogenous and transfected CENP-F onto the mitochondrial network without any obvious localization elsewhere. Scale bars, 10 µm. (E) TIRF images of live U2OS cells coexpressing CENP-F^GFP (green) and RFP-EB1 (red). Arrowheads point at CENP-F foci found at extreme tips of growing microtubules. Scale bar, 5 µm. (F) Kymograph of the live images in E. Scale bars, 1 µm and 1 s. (G) Quantification of the distance traveled (top), lifetime (middle), and speed of comets labeled with EB1 (left) and CENP-F (right). Note that all comets bearing CENPF^GFP signal were also positive for EB1, whereas the reverse was not true.

