FIGURE 3:
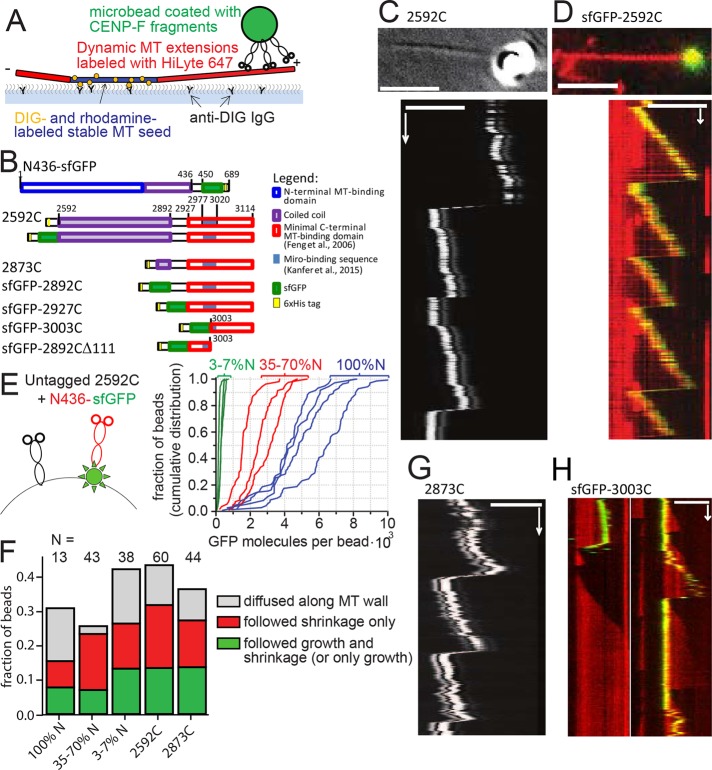
Transport of CENP-F–coated beads by dynamic MT tips in vitro. (A) Experimental setup is analogous to Figure 2B, except that CENP-F–coated beads are used instead of mitochondria. (B) Domain organization of the C-terminal fragments of CENP-F used. Numbers show amino acid position in the full-length human CENP-F. (C) Top, DIC image showing a 1-µm glass bead coated with 2592C on a growing microtubule tip (averaged from 20 sequential frames). Bottom, kymograph showing movement of the same bead with the microtubule tip. (D) Top, 1-µm glass bead coated with sfGFP-2592C (green) on a dynamic microtubule labeled with HiLyte-647 (red). Bottom, kymograph showing movement of the same bead. (E) Mixtures of untagged 2592C and sfGFP-tagged N436 were added to the beads (left; not to scale). The graph shows cumulative distributions of individual bead fluorescence for three molar ratios of 2592C and N436-sfGFP: 1:10 (green) 1:1 (red), and only N436-sfGFP (blue). Intensity of a single GFP molecule was determined from the bleaching curves of individual N436-sfGFP molecules as described in Materials and Methods. (F) Fates of the beads that were successfully bound to dynamic microtubules, depending on the bead coating. (G) Kymograph showing the movement of a 1-µm glass bead coated with 2873C and attached to the tip of a dynamic microtubule by means of an optical trap; the bead and microtubule dynamics were imaged using DIC optics. (H) Beads coated with sfGFP-3003C (green) were allowed to bind spontaneously to dynamic microtubules grown using HiLyte-627–labeled tubulin (red). Images show two representative kymographs. Scale bars, 60 s (vertical); 5 µm (horizontal).

