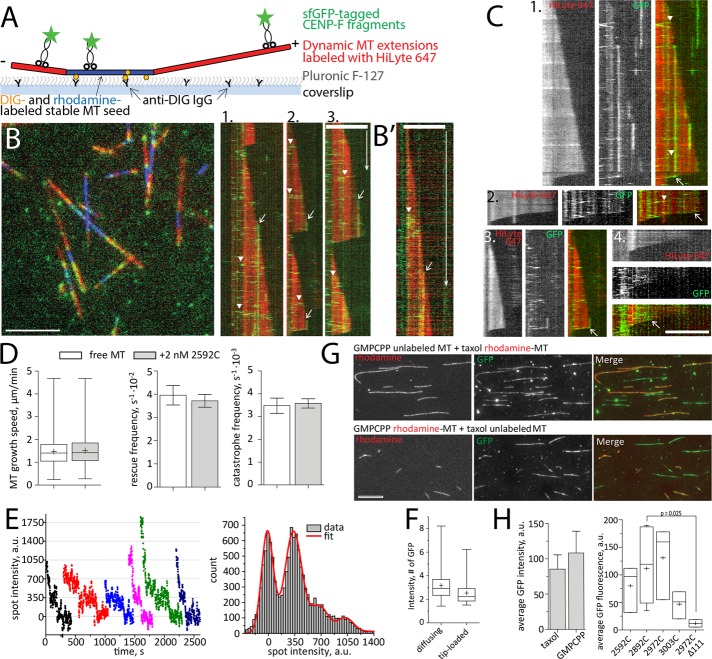
FIGURE 4:
Interaction of CENP-F with dynamic MTs in vitro. (A) Experimental setup. (B) Left, dynamic MT extensions (red) growing from stable MT seeds (blue) were imaged in TIRF in the presence of 2 nM sfGFP-2592C (green). Right, kymographs showing fast-diffusing molecules of sfGFP-2592C loaded along the microtubule lattice (arrowheads) and immobile spots loaded at the growing microtubule tips (arrows). (B′) A diffusing lattice-loaded complex (arrowhead) and tip-loaded immobile complex (arrow) imaged with a faster acquisition rate. (C) Kymographs showing tip-loading complexes that move with microtubule disassembly (arrows). Arrowheads indicate molecules diffusing along the microtubule lattice. (D) Microtubule growth speed, rescue frequency, and catastrophe frequency in the absence (white bars) and presence (gray bars) of 2 nM 2592C. Data are summarized from 531 growth and shrinkage events for free microtubules and 610 such events in the presence of CENP-F obtained in three independent experiments. Here and elsewhere, bar graphs show mean ± SEM, box-and-whiskers graphs show 25–75% (box), minimum and maximum (whiskers), median (horizontal line), and mean (+). (E) Bleaching curves of GFP-tagged CENP-F fragments (left) and the summary histogram of all spot intensities during photobleaching (right). The histogram is fitted with the equidistant Gaussian function (red curve). (F) Intensity of 109 immobile tip-loaded and 166 diffusing lattice-loaded molecules of sfGFP-2592C in dynamic microtubule assay. (G) Flow chambers with a mixture of unlabeled GMPCPP-stabilized and rhodamine-labeled, Taxol-stabilized microtubules (top) or vice versa (bottom) were incubated with sfGFP-2592C. The graph shows quantification of the microtubule-associated GFP fluorescence. The values are summarized from 432 Taxol-stabilized microtubules and 1018 GMPCPP-stabilized microtubules measured in four independent experiments. (H) Microtubule-associated GFP intensity in the presence of truncated fragments of CENP-F C-terminus. Data are from three independent experiments for sfGFP-2592C, sfGFP-2927C, and sfGFP-3003C; 11 experiments for sfGFP-2892C and two experiments for sfGFP-2892CΔ111. The p value is reported based on a Mann–Whitney–Wilcoxon rank sum test. Scale bars, 60 s (vertical), 5 µm (horizontal).

