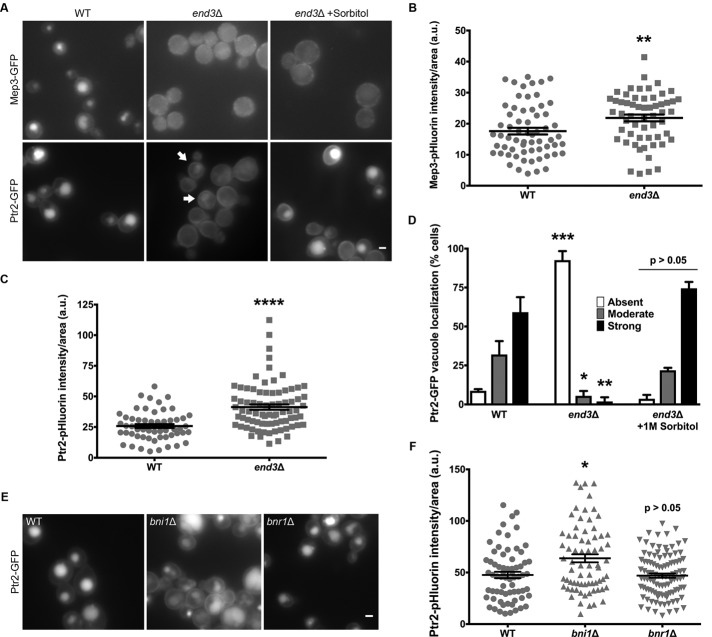
FIGURE 6:
Ptr2 can be trafficked via clathrin-independent endocytosis. (A) Cells expressing Mep3-GFP or Ptr2-GFP and lacking End3 were grown on rich medium alongside WT strains in the absence or presence of osmotic support (1 M sorbitol) and imaged by fluorescence microscopy. Arrows indicate cells with internalized Ptr2-GFP. Scale bar, 2 μm. (B) Intensity of Mep3-pHluorin was quantified; intensity values were corrected for cell size and expressed in arbitrary units (a.u.). Error bars indicate mean ± SEM; **p < 0.01 compared with WT. (C) Intensity of Ptr2-pHluorin was quantified; intensity values were corrected for cell size and expressed in arbitrary units (a.u.). Error bars indicate mean ± SEM; ****p < 0.0001 compared with WT. (D) For each condition, Ptr2-GFP–expressing cells were quantified as having a strong, moderate, or weak/absent vacuolar signal, and the percentage in each category was plotted. Error bars indicate mean ± SD; n = 2; *p < 0.05, **p < 0.01, ***p < 0.001 compared with WT. (E) WT, bni1Δ, and bnr1Δ cells expressing Ptr2-GFP were grown on rich medium and imaged by fluorescence microscopy. Scale bar, 2 μm. (F) Intensity of Ptr2-pHluorin was quantified for each condition; intensity values were corrected for cell size and expressed in arbitrary units (a.u.). Error bars indicate mean ± SEM; *p < 0.05 compared with WT.

