FIGURE 7:
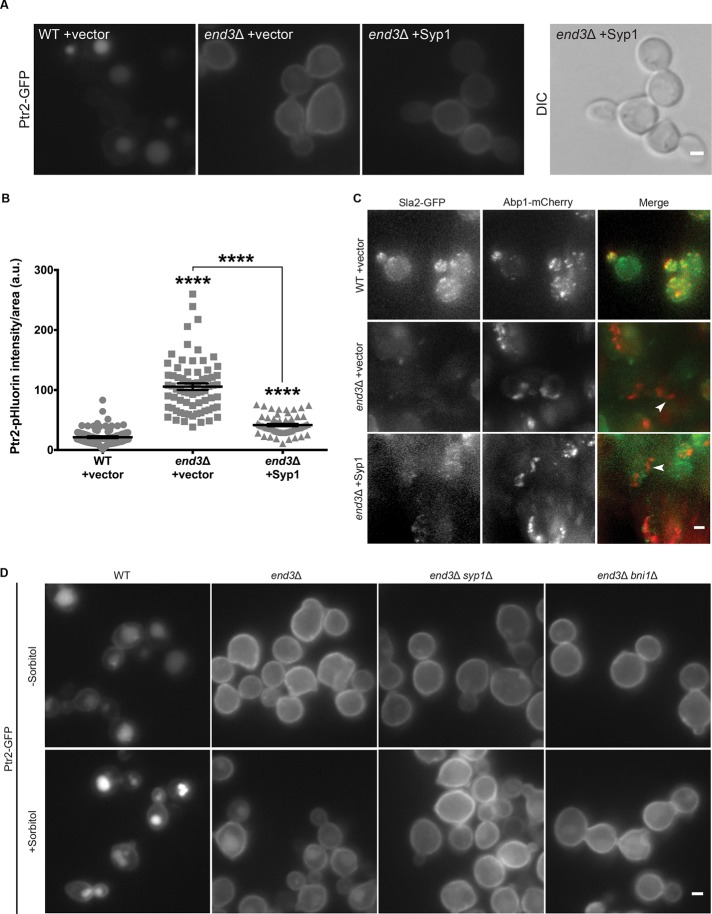
Syp1-mediated internalization of Ptr2 occurs via CIE in addition to CME. (A) WT and end3Δ cells expressing Ptr2-GFP were transformed with either an empty or SYP1-containing high-copy vector and imaged via live-cell fluorescence microscopy. Scale bar, 2 μm. (B) Intensity of Ptr2-pHluorin was quantified for each condition; intensity values were corrected for cell size and expressed in arbitrary units (a.u.). Error bars indicate mean ± SEM; ****p < 0.0001 compared with WT. (C) WT and end3Δ cells expressing Sla2-GFP and Abp1-mCherry were transformed with either an empty or SYP1-containing high-copy vector and imaged via live-cell fluorescence microscopy. Maximum intensity projection images generated from Z-stacks. Scale bar, 2 μm. (D) Cells expressing Ptr2-GFP in WT, end3Δ, end3Δ syp1Δ, or end3Δ bni1Δ strains were grown on rich medium in the presence or absence of 1 M sorbitol and imaged by fluorescence microscopy. Scale bar, 2 μm.

