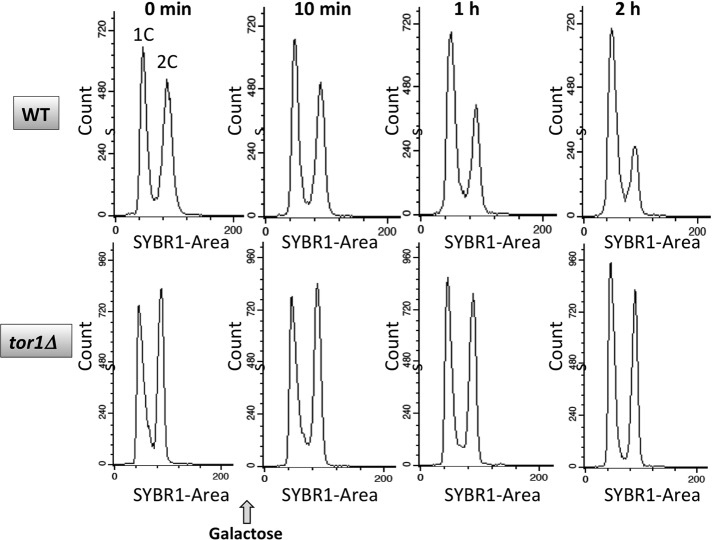
FIGURE 12:
Flow-cytometric analysis of cell cycle progression after induction of DSB. Total DNA content of asynchronous cells is presented on the x-axis and cell counts on the y-axis. WT (top) and tor1Δ cells (bottom) were collected before (0 min) and at the indicated times after addition of galactose to induce DSB. Data are representative of duplicate experiments.

