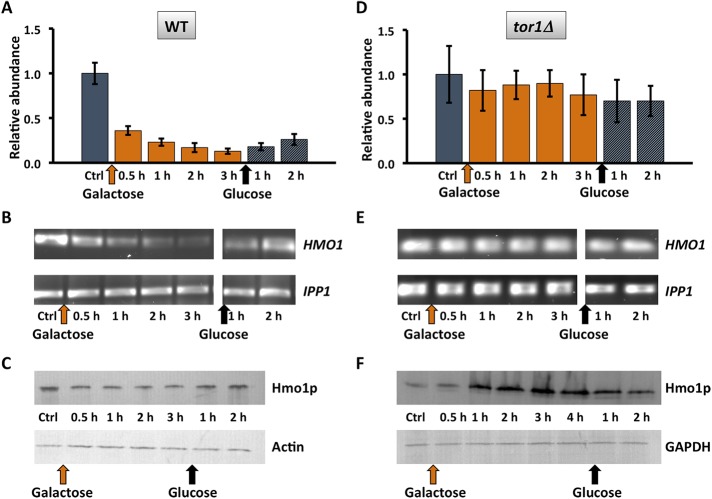
FIGURE 2:
Reduced HMO1 expression after DSB induction requires Tor1p. (A, D) HMO1 expression in WT and tor1Δ cells before (Ctrl; gray bar) and after induction of HO endonuclease expression by addition of galactose (orange bars); HO endonuclease creates a DSB at the MAT locus. DNA repair is induced by addition of glucose (gray bars). Expression levels are normalized to that of control cells. Three independent experiments were performed. Error bars represent SD. (B, E) Representative gel images illustrating expression of HMO1 and IPP1 (reference gene) in WT and tor1Δ cells, respectively. (C, F) Western blot corresponding to expression data shown directly above using antibody to the FLAG tags. GAPDH or actin expression levels were used as internal loading controls, and the blots are representative of three independent experiments.

