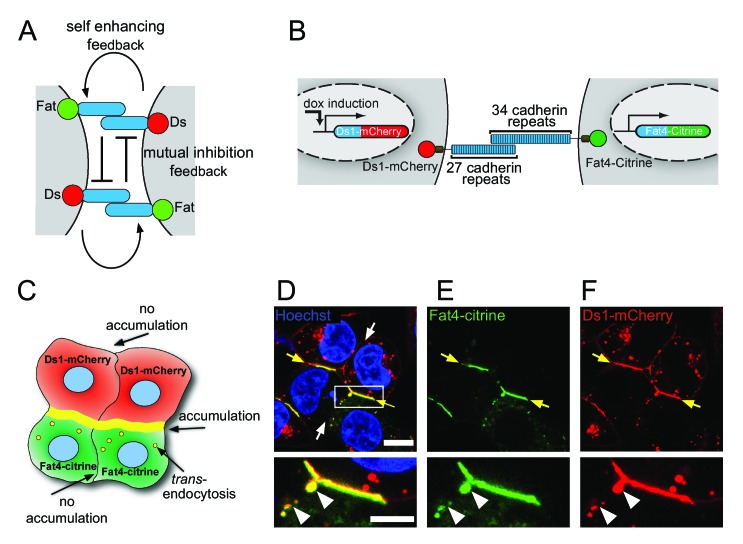
Figure 1. Fat4-Citrine and Ds1-mCherry accumulate on heterotypic boundaries.
(A) Schematic of the localized feedback hypothesis. (B) Schematic illustration of the stable cell lines and fusion constructs of Fat4-citrine and inducible Ds1-mCherry. (C) Schematic illustration of the cell-cell boundaries formed in a co-culture assay of Fat4-citrine (green) and Ds1-mCherry (red) cells. Yellow boundary represents accumulation at heterotypic boundaries. Yellow vesicles represent trans-endocytosis of Ds1-mCherry into Fat4-citrine expressing cells. (D–F) A co-culture of HEK-Fat4-citrine cells (green) and HEK-Ds1-mCherry cells (red). Strong accumulation is observed on heterotypic boundaries (yellow arrows). No accumulation is observed on homotypic boundaries (white arrows). Zoom in on the accumulation area (white box in D) demonstrates that Ds1-mCherry trans-endocytoses (white triangles) into Fat4-citrine expressing cell (but not vice-versa). Nuclei are stained with Hoechst (blue). Scale bar - 20 µm. Supplementary figure (Figure 1—figure supplement 1) shows Western blot analysis, monoculture images from Fat4-citrine and Ds1-mCherry cell lines and boundary accumulation in co-culture between MCF7-Fat4-citrine and MCF7-Ds1-mCherry cells.


